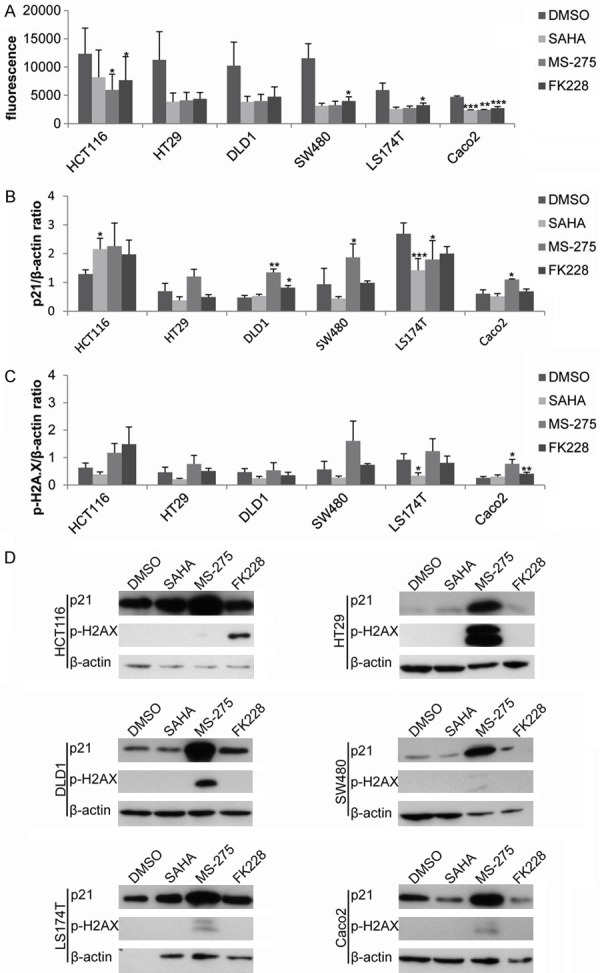
Figure 5.

Cellular responses induced by HDACi. HDAC activity was measured 24 h post HDACi addition (A). Immunoblotting with subsequent quantification was performed for induction of p21 expression (B) and DNA damage by γH2A-X (C). One representative immunoblot is shown for both p21 and γH2A-X (D). Diagrams show the mean +/- SEM of three independent experiments. P-values are provided as *: 0.05-0.01, **: ≤ 0.01-0.001 and ***: ≤ 0.001.
