
Figure 2.
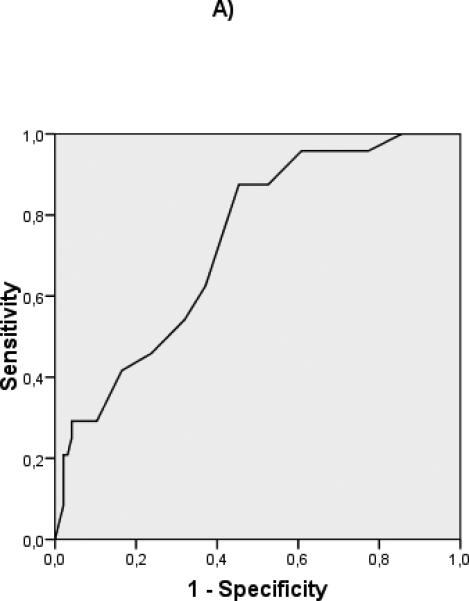
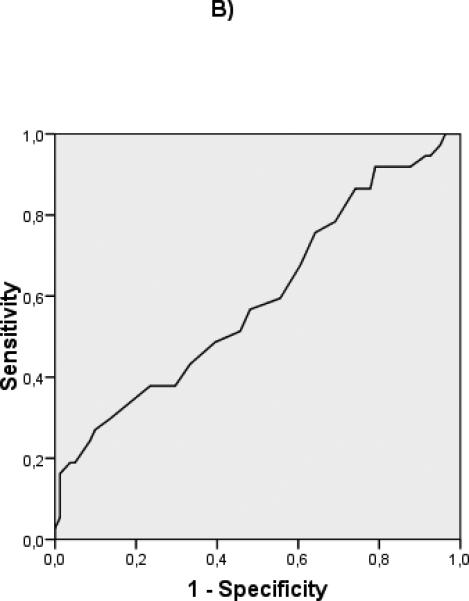
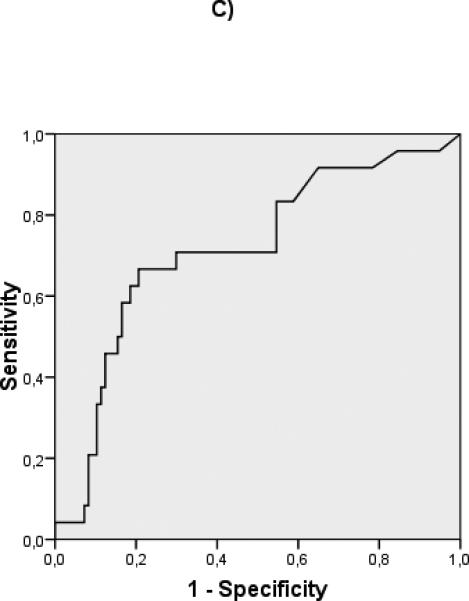
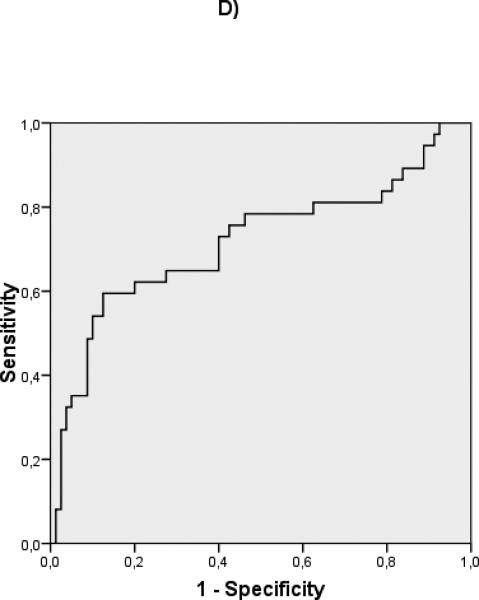
ROC curves of albumin for compensated (A) (c-statistic 0.732) and decompensated (B) (c-statistic 0.594) patients. ROC curves of MELD for compensated (C) (c-statistic 0.715) and decompensated (D) (c-statistic 0.717) patients.
Official websites use .gov
A
.gov website belongs to an official
government organization in the United States.
Secure .gov websites use HTTPS
A lock (
) or https:// means you've safely
connected to the .gov website. Share sensitive
information only on official, secure websites.
ROC curves of albumin for compensated (A) (c-statistic 0.732) and decompensated (B) (c-statistic 0.594) patients. ROC curves of MELD for compensated (C) (c-statistic 0.715) and decompensated (D) (c-statistic 0.717) patients.