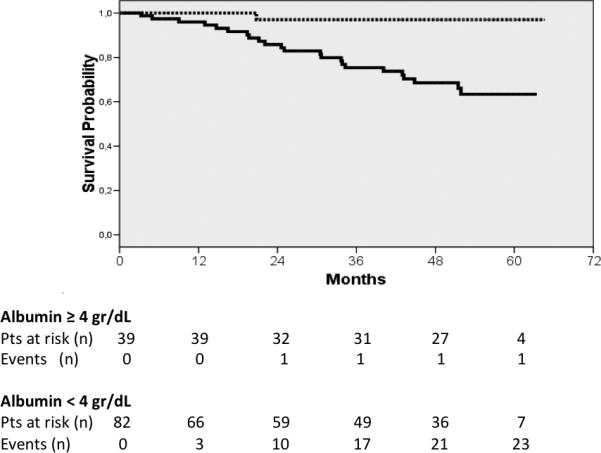
Figure 3.

Kaplan-Meier curves of compensated patients according to the cut-off albumin (≥ 4 g/dL discontinuous line, < 4 g/dL continuous line). Log rank test 10.904, p value = 0.001.

Kaplan-Meier curves of compensated patients according to the cut-off albumin (≥ 4 g/dL discontinuous line, < 4 g/dL continuous line). Log rank test 10.904, p value = 0.001.