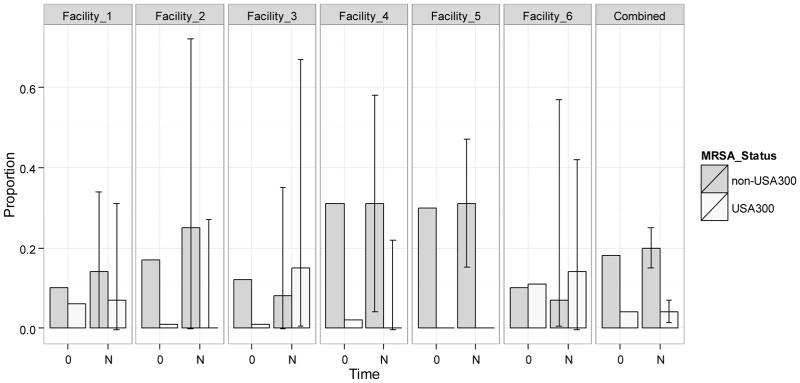
Figure 2.
Observed distribution of subjects colonized with non-USA300 or USA300 at baseline and predicted distribution with 95% confidence intervals at steady state. USA300 includes those few residents co-colonized with non-USA300. Horizontal axis represents time: 0 stands for baseline, and N stands for steady-state. The 95% confidence intervals at steady-state are depicted with error bars. The columns show the distribution in each facility; the last column labeled Combined presents the distribution in all facilities combined.

