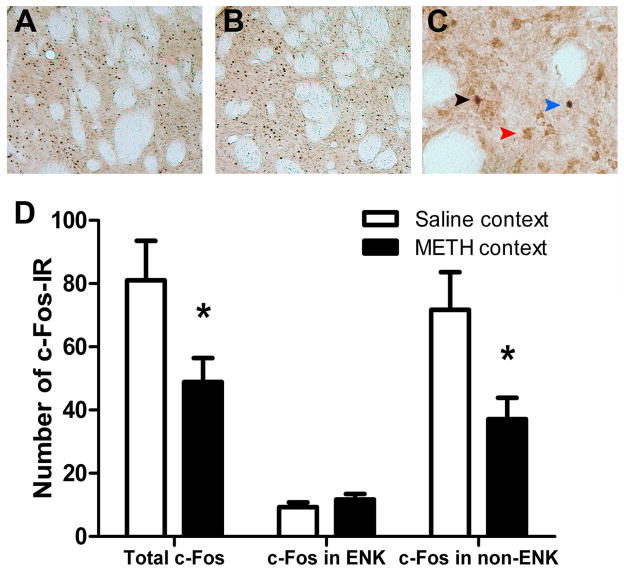
Figure 3.
c-FOS and ENK-IR photomicrographs and cell counts in the pDMS for rats that underwent the negative feedback test in Experiment 2B. Panels A–C show representative c-Fos-IR in the DMS in: (A) the saline group (B) the METH group and (C) in a section double labelled for c-Fos-IR and ENK-IR; c-Fos+ENK = black arrow; ENK only = red arrow; c-Fos only = blue arrow. (D) Counts revealed that differences in c-Fos-IR between the saline and METH contexts occurred in the single rather than double-labelled c-Fos-IR+ENK neurons (i.e. non-ENK neurons, likely D1 neurons). It can be seen that there was less total c-Fos for rats exposed to the METH context, as well as less c-Fos-IR in non-ENK neurons rather than c-Fos-IR double stained with ENK, than rats exposed to the saline context.

