
Figure 4.
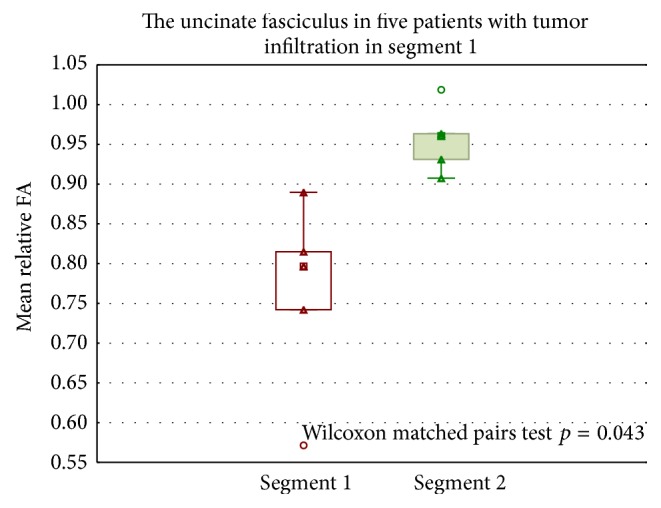
Box plot of rFA in tract segments. rFA in segments 1 and 2 in the uncinate fasciculus, in five patients with tumor infiltration in segment 1. Significantly lower rFA in segment 1 compared to segment 2. Wilcoxon matched pairs test, p = 0.043. rFA = relative fractional anisotropy.