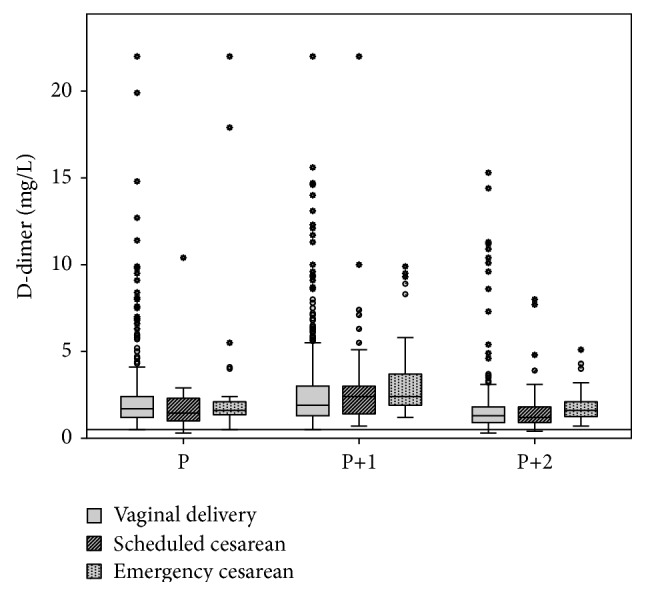
Figure 3.

D-dimer during delivery and the early postpartum period. The box plots represent the central distribution of D-dimer concentration (25th–75th percentile), while the horizontal bar in the middle of each box plot represents the median value. The “whiskers” represent the range of values, excluding outliers (circles) and extreme values (asterisks). The results are shown for vaginal delivery, scheduled cesarean section, or emergency cesarean section during delivery (P) and on the first (P+1) and second (P+2) postpartum days. The horizontal line represents the conventional threshold of 0.5 mg/L (FEU).
