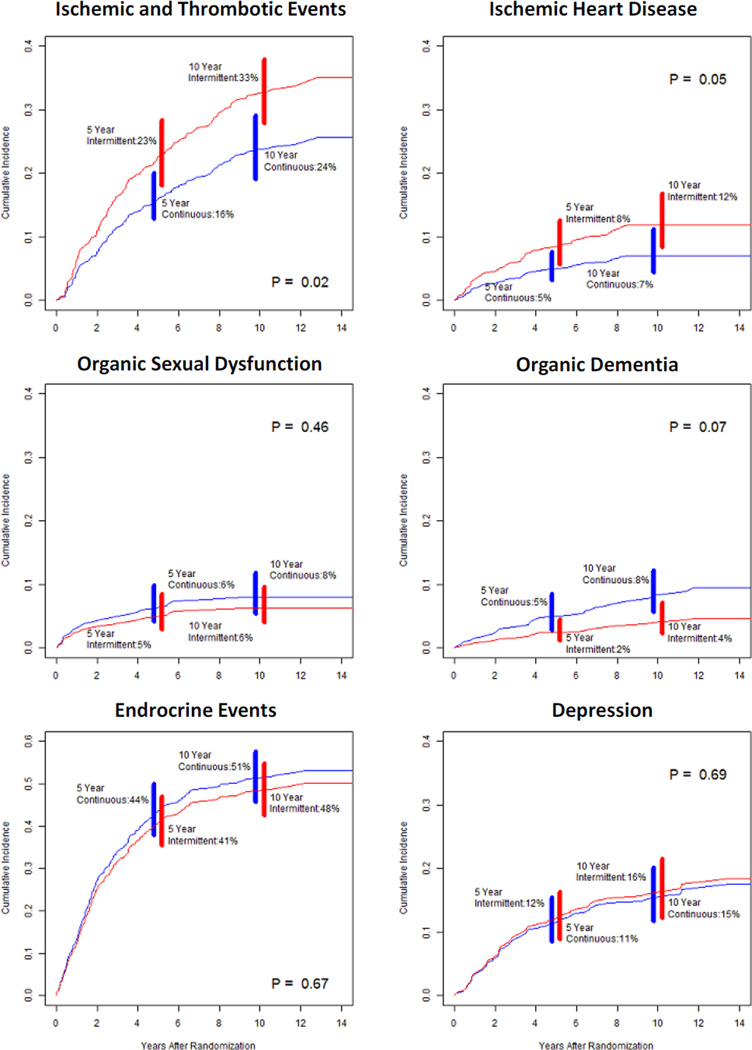
Figure 1.
Predicted cumulative incidence of each individual adverse health event by treatment arm*
The p-values associated with each curve represent the multivariate competing risk regression p-values for the association of treatment and each individual adverse event, adjusting for demographic and stratification

