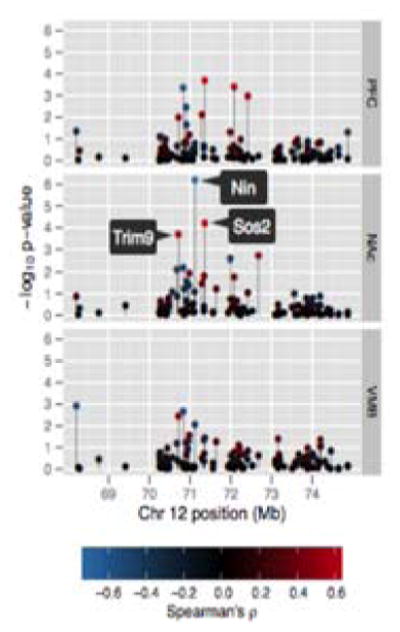
Figure 6. Correlation of ethanol-induced anxiolysis and candidate gene expression in the mesocorticolimbic reward circuit.

The y-axis indicates significance (Spearman ρ) of correlation between distance traveled in light (DTL) following ethanol and microarray expression values in the PFC, NAc, or VMB for candidate genes within the Etanq1 interval. Gene positions on Chr 12 are plotted on the x-axis. Correlation direction/significance is represented by point color. Gene symbols are provided for phenotype correlations significant on FDR analysis (q-value < .05).
