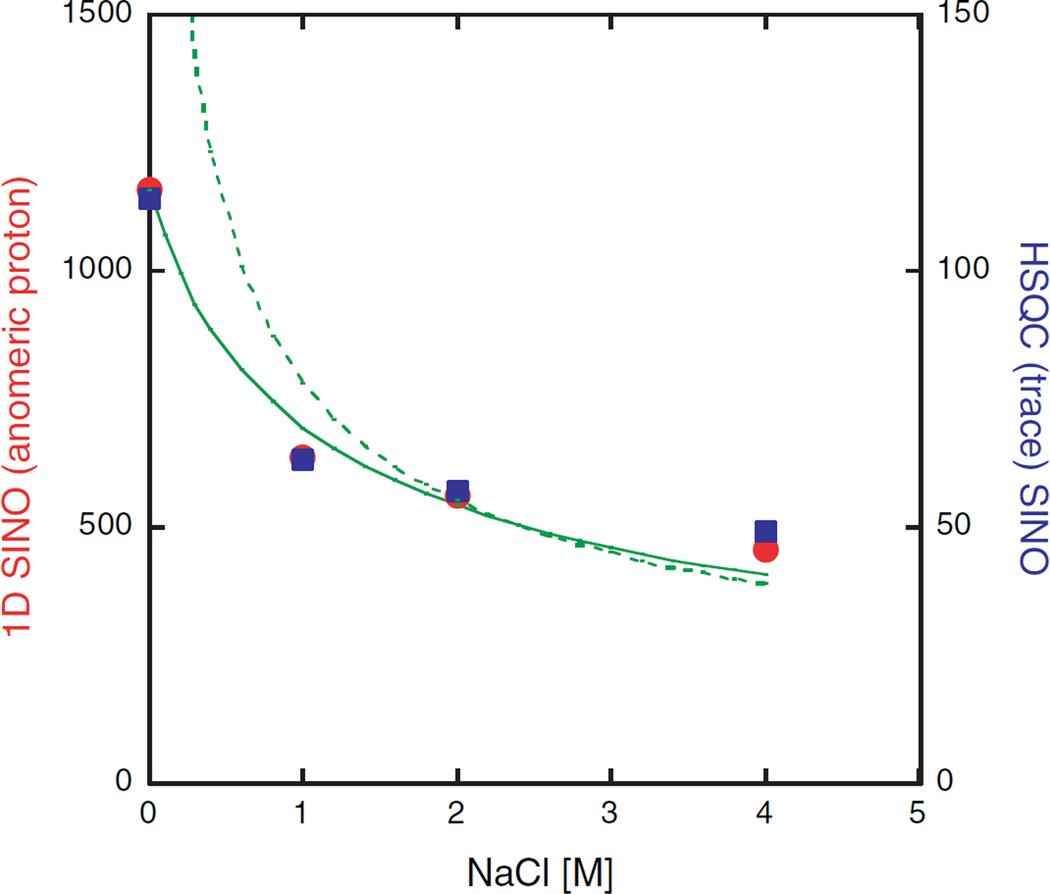
Fig. 4.
Signal-to-noise data of 10 mM sucrose, 3 mm NMR tube as a function of the NaCl concentration. S/N analysis of 1D 1H spectra (left ordinate, ●) and HSQC trace (right ordinate, ■) for the anomeric proton (0.5 ppm noise region). The solid line depicts the predicted salt dependence for the 1D data based on Eq. (1). where [NaCl] is the salt concentration [M] and f is a proportionality constant. The sample resistance is expressed as cr4[NaCl]. c incorporates several constants and is the sample radius [mm]. The following values were obtained for the radical: . If no salt is present the S/N is primarily determined by the second term in Eq. (1), while at 2 M NaCl it is assumed that the first term dominates, therefore the S/N curve may be approximated as k*[NaCl]−0.5 where k = 792, for 3 mm tubes (dotted line). This fit provides a simple estimation of the S/N dependency at high salt concentrations. In either case, the conductivity is assumed to be proportional to the salt concentration which for high salt solutions is no longer accurate.

