
Figure 2. Persistence of γ-H2Ax foci in Cisplatin-IR treated cells by Immunofluorescence.
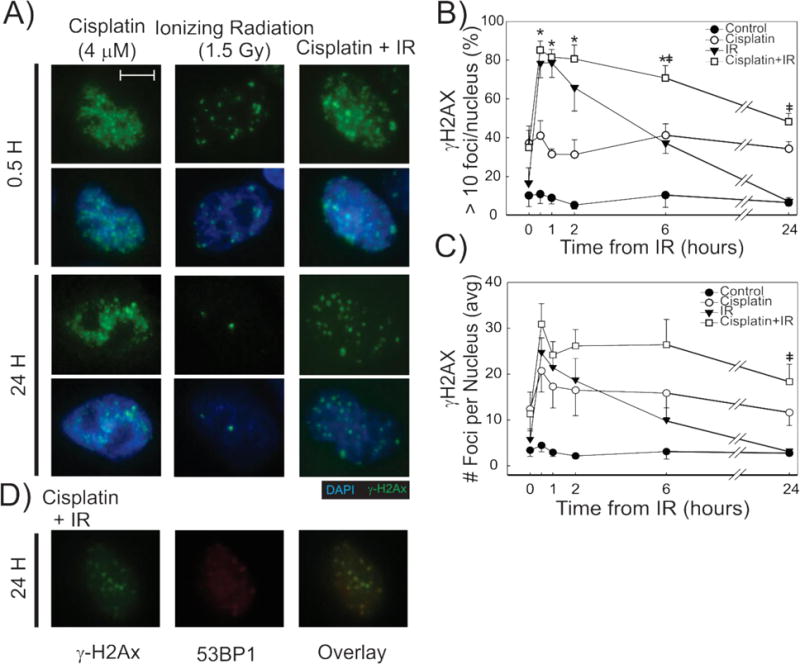
Representative fluorescence microscopy images for the indicated treatments and time-points (A), show differences in γH2Ax IF pattern. 100× magnification. Size bar = 5 μm. γ-H2Ax foci were quantified and the % cells with > 10 foci (B) and number of foci per nucleus (C) are plotted by time from IR for each of the treatments in H460 cells. N=3 biological replicates for each, +/− SEM. Differences are statistically significant in CDDP-IR treated cells when compared to CDDP (*) and IR (‡) using p<0.05. Representative fluorescence microscopy images show γ-H2Ax (green), 53BP1 (red) staining and an overlay of both in H460 cells 24-hours after treatment with combination CDDP-IR (D).