
Figure 5. Effects of ATM inhibition on DNA damage response and γ-H2Ax foci formation.
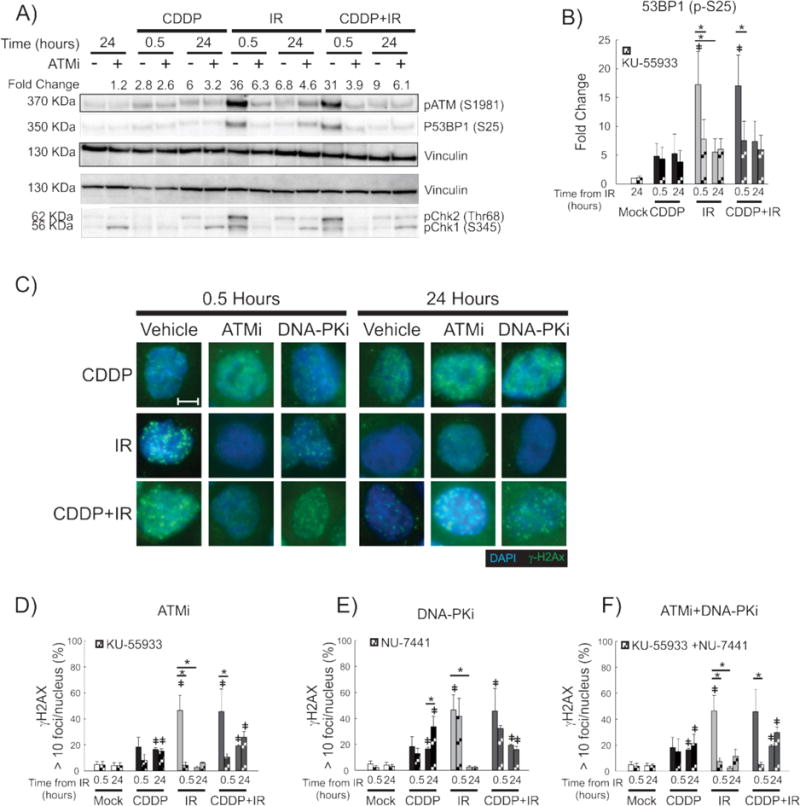
A representative immunoblot with vinculin used as a loading control (A) shows the impact of ATM inhibition following treatment with the ATM inhibitor, KU55933, on the DDR initiated by the treatments shown. Effect on the DDR is shown early (30 minutes) and late (24 hours) after IR/mock treatment with mean fold change in pATM expression shown above the immunoblot. Quantification of P53BP1 expression as a measure of treatment and time from IR is shown as fold-change over the untreated control (B). Representative fluorescence microscopy images of H460 cells are shown for the indicated treatments and time-points (C). Quantification of early and late γ-H2Ax-positive H460 cells treated with KU-55933 (ATMi; D), NU-7441 (DNA-PKi; E) and both inhibitors (F). 100× magnification. Size bar = 5 μm. *p<0.05, ‡ p<0.05 compared to untreated control.