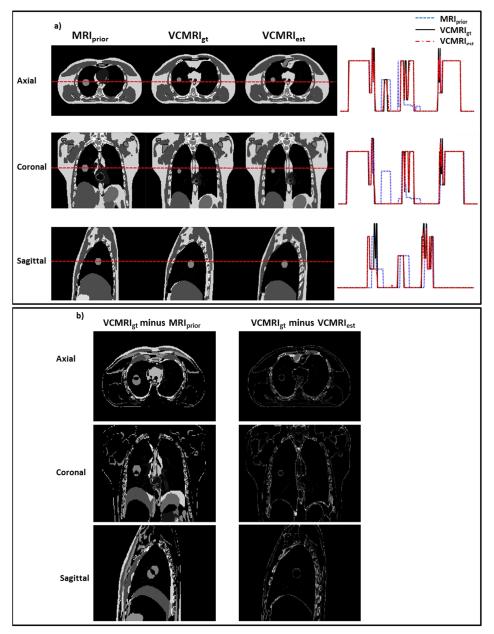
Figure 1.
a) Comparison of prior MRI (MRIprior) at end-expiration phase, ground-truth on-board VC-MRI (VCMRIgt) at end-inspiration phase and estimated on-board VC-MRI (VCMRIest) for XCAT scenario 1. The VC-MRI was estimated using the entire 2D cine-MRI in the axial view. The horizontal red dotted line corresponds to the location of the profile curves shown to the right of the images. b) Subtraction images for the axial, coronal and sagittal images shown in Fig. 1a).

