
Fig. 2.
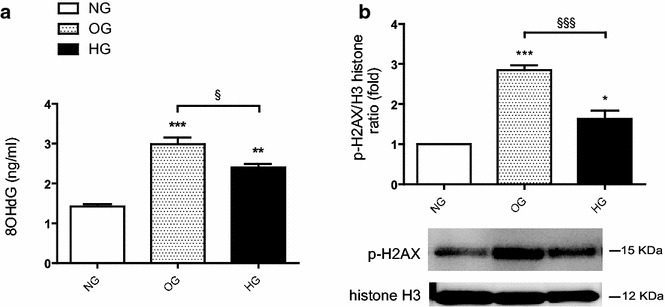
Effects of oscillating and high glucose on oxidative stress markers in HUVECs. a 8-OHdG content (ng/ml) in HUVECs during OG, HG and NG. b γ-H2AX in HUVECs during OG, HG and NG. The results are expressed as mean (± SEM), (*p < 0.05, **p < 0.01, ***p < 0.001 vs control). Symbols over the bars refer to differences between the conditions shown under the bars (§p < 0.05, §§§p < 0.001)