
Fig. 2.
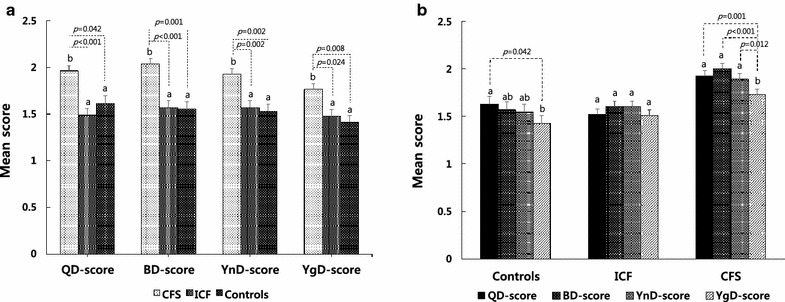
Least mean square plot for QBYY-Q scores. a Least mean squares of each QBYY-Q score according to the control, ICF, and CFS groups; b Least mean squares of QBYY-Q scores among the control, ICF, and CFS groups after adjustment for sex and age. Dotted lines denote the significant pairwise comparisons in which the P value was less than 0.05. Alphabetic notations (i.e., a, ab and b) above the standard error bars indicate the homogeneous groups resulting from Tukey’s HSD test for multiple comparisons