Fig. 1.

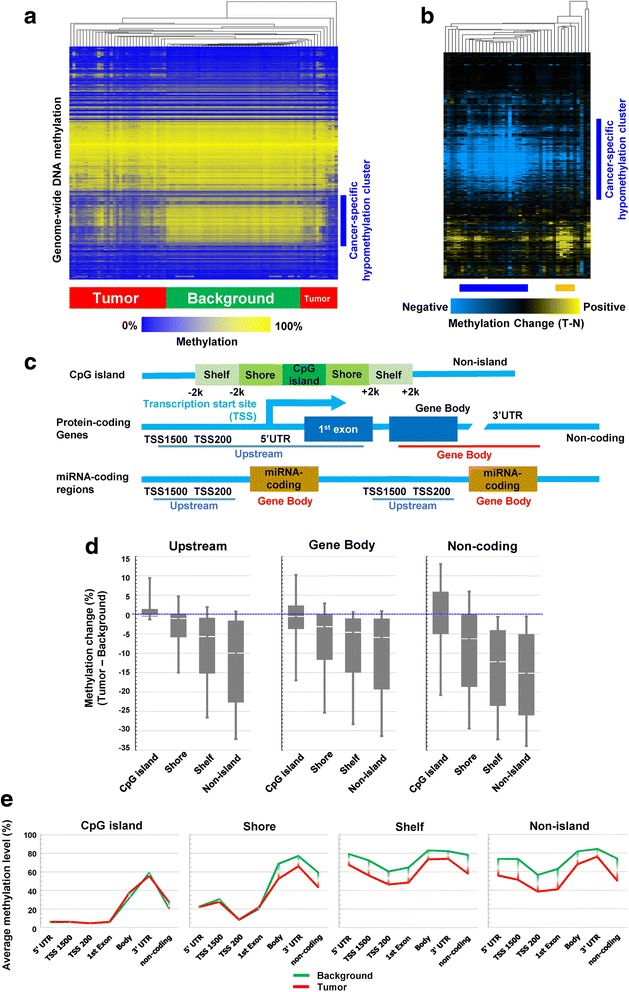
Genome-wide DNA methylation analyses of tumor and background tissues in non-B non-C hepatocellular carcinoma patients. a. Hierarchical clustering of genome-wide methylation data from analysis of tumor and background tissues. Each column corresponds to a single sample. Methylation analysis was performed using the Infinium HumanMethylation450 BeadChip. One percent of probes were randomly sampled for the analysis. b. Hierarchical clustering of the difference in genome-wide methylation level between tumor and background pair tissues. Each single column corresponds to each case. Yellow indicates tumor > background (hypermethylation), and blue indicates background > tumor (hypomethylation). The orange bar under the heatmap suggests a subgroup that shows relatively stronger hypermethylation, and the blue bar suggests a subgroup with remarkable hypomethlyation and low frequency of hypermethylated genes. c. Upper: a schema of the structure of a CpG island, and the definition of regions around such CpG islands. Middle: a schema of the structure of protein-coding genes, and relative positions of the terms related to distance from transcription start site. Lower: a schema of the structure of miRNA-coding regions. We defined “upstream” and “gene body” regions as shown in the figure. d. Relative methylation change (background levels subtracted from tumor levels) stratified by probe annotation (relative location from gene and CpG island: upstream/gene body/non-coding regions and CpG island/shore/shelf/non-island). e. Absolute methylation levels stratified by probe annotation (relative location from gene and CpG island). The gap between green and red lines indicates the difference in the methylation levels between background and tumor tissue. The gap was clearly observed in shelf/non-island regions and ranged from 10 to 20%
