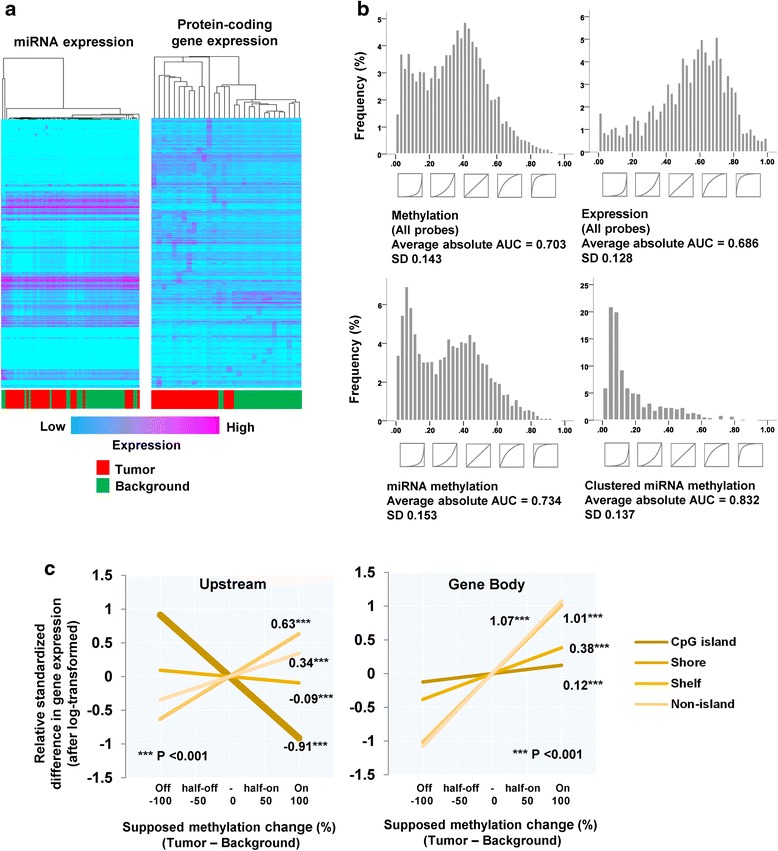
Fig. 5.

Assessment of ability for tumor discrimination, and regulation of protein-coding gene expression by methylation. a. Hierarchical clustering of genome-wide microRNA and protein-coding gene expression analysis data from tumor and background tissues. One percent of probes were randomly sampled for the analysis of protein-coding genes. b. Histogram plots of area under curves (AUC) of repeated receiver operator characteristic (ROC) analysis in respect of ability to discriminate tumor from background tissue. Curves shown below are images of representative results from ROC analysis for various probes. c. Visualization of a statistical model relating expression of protein-coding genes with respective methylation change stratified by relative location from gene and CpG island. The effect of methylation change was estimated from regression coefficients for the relative methylation change. Methylation and expression levels in background were also included as covariate. Darkest line: CpG island, darker: Shore, lighter: Shelf, lightest: Non-island
