
Figure 4.
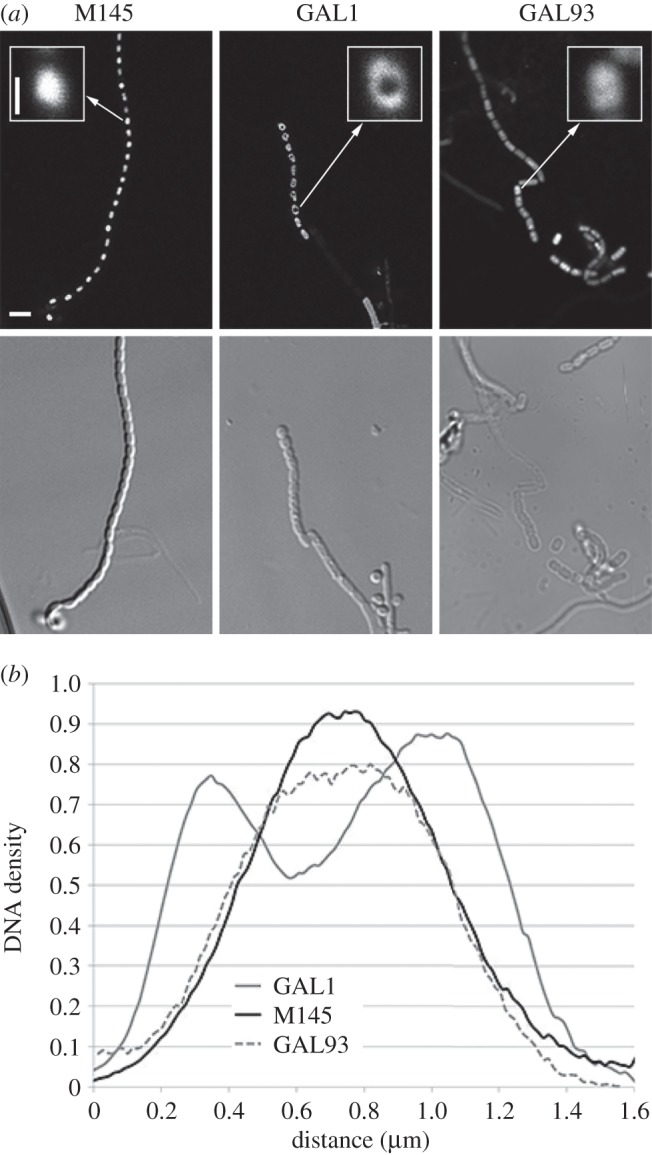
Aberrant nucleoid distribution in sepG mutant spores. (a) Fluorescence micrographs of nucleoid distribution in the spores; Top, STED images; bottom, light images. DNA staining of wild-type spores (M145, left) shows normal spore lengths and proper nucleoid condensation. In contrast, nucleoids of sepG null mutants (GAL1, middle) appear toroid and less well condensed. The aberrant nucleoid shape is complemented by a clone expressing sepG (strain GAL93; right), but DNA condensation is still affected. Inset: 7× magnification of representative nucleoids. Cultures were grown on SFM agar plates for 5 days at 30°C. Bar, 2 µm. Bar for inset, 500 nm. (b) DNA distribution along single spores in S. coelicolor M145, in GAL1 and in GAL93. The x-axis represents the distance between two poles of the spores, and the y-axis shows the DNA density. Note the double peak for GAL1, highlighting higher density of DNA to the spore periphery when sepG is absent, while in wild-type and GAL93 spores the nucleoid is localized to the centre.