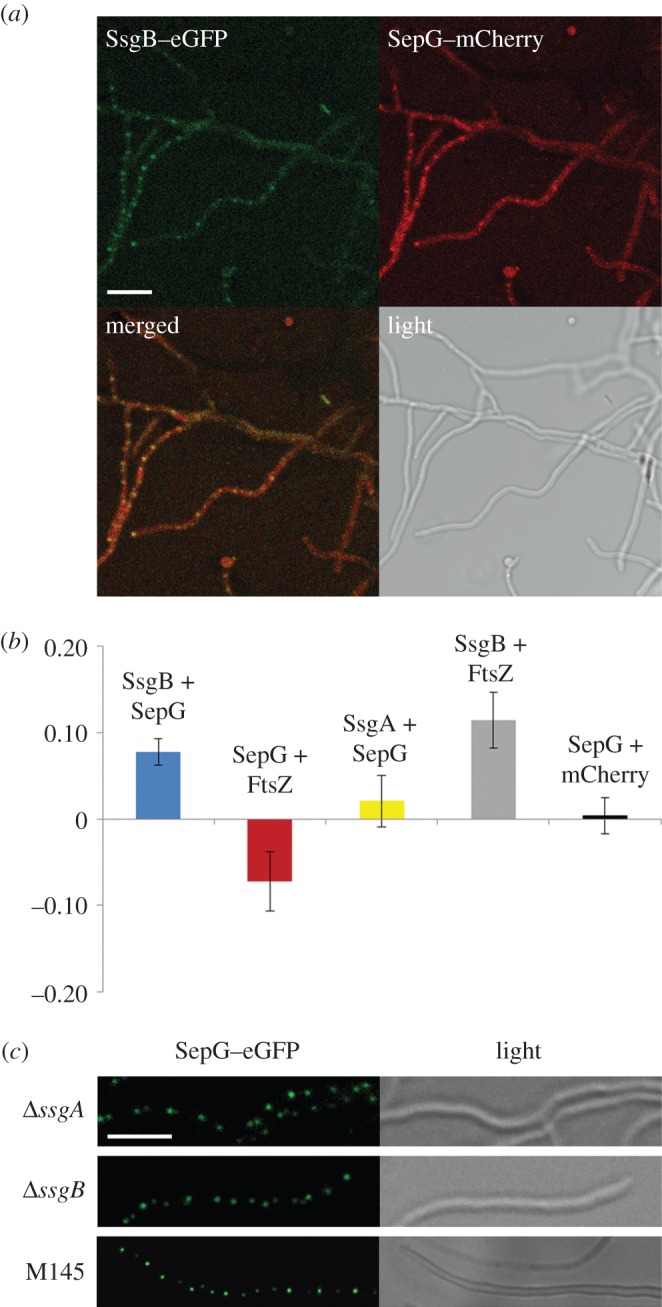
Figure 7.

FRET imaging of the interaction between SepG and SsgB. (a) FM images showing the colocalization of SsgB and SepG. Scale bar, 5 µm. (b) Graphical representations of the FRET data. All efficiencies are represented relative to the control (which was set to zero). FRET data are summarized in table 2. (c) FM images showing localization of SepG–eGFP in ssgA- and ssgB-null mutants. Scale bar, 2 µm.
