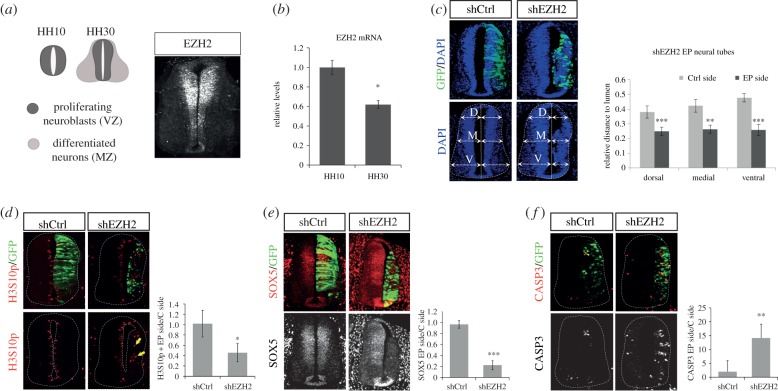
Figure 1.
EZH2 depletion leads to small and structurally disorganized neural tubes. (a) Diagrams show regions occupied by proliferating neural progenitors (ventricular zone, VZ) and post-mitotic neurons (mantle zone, MZ) in HH10 (only progenitors) and HH30 chick embryo spinal cord (left panel). HH30 wild-type embryo neural tubes were immunostained using anti-EZH2 antibody (right panel). (b) Ten HH10 or HH30 embryo neural tubes were dissected out for each replicate. mRNA was extracted and retrotranscribed for qPCR analysis. The graph shows EZH2 mRNA, normalized by GAPDH mRNA levels. Results are means of three independent experiments. Error bars indicate s.d. *p < 0.05. (c) HH11–12 embryos were co-electroporated with a mixture of shRNA-EZH2(1) and shRNA-EZH2(2) (shEZH2) or shRNA-control (shCtrl) cloned into pSHIN vector expressing GFP. Transversal sections of electroporated neural tubes as indicated above stained with DAPI 48 h PE. Graphs show the quantification of the size of the control side and shEZH2-electroporated side. To do that, we measured the dorsal, medial and ventral distances to the lumen on each side, relative to the length of the central line of the lumen. Data represent mean of n = 10–20 sections (from three to five embryos). Error bars indicate s.d. **p < 0.01; ***p < 0.001. (d–f) Transversal sections of neural tubes from HH11–12 embryos electroporated in ovo with shCtrl or shEZH2 and stained for H3S10p (d), Sox5 (e) or caspase 3 (f) 48 h PE. Graphs show the quantification of the corresponding immunostaining. Data represent mean of n = 20–30 sections (from four to six embryos). Error bars indicate s.d. *p < 0.05; **p < 0.01; ***p < 0.001.

