Figure 5.
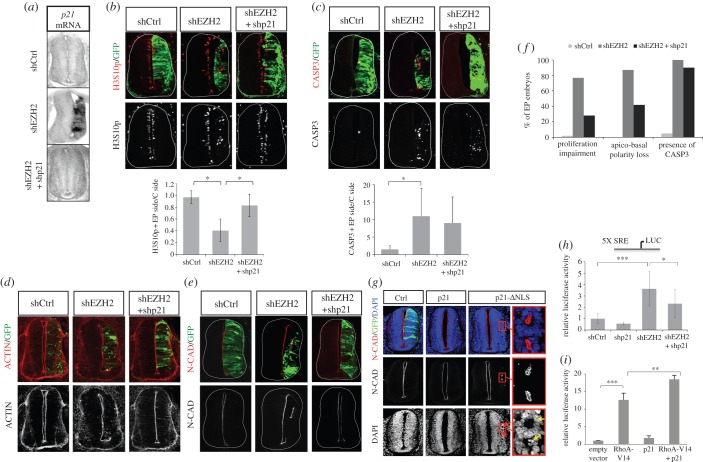
shp21 rescues neural progenitor proliferation and apicobasal polarity. (a) p21WAF1/CIP1 ISH 48 h after in ovo electroporation of shCtrl, shEZH2 or shEZH2 and shp21 in HH11–12 embryo neural tubes. (b–e) Transversal sections of neural tube from HH11–12 embryos electroporated in ovo with shCtrl, shEZH2 or shEZH2 and shp21 and stained with H3S10p (b), caspase 3 (CASP3, c) and N-cadherin (N-CAD, e) antibodies or with phalloidin-rhodamine (d) 48 h PE. Graphs below the panels show the quantification of the corresponding immunostaining. Data represent mean of n = 20–40 sections (from four to six embryos). Error bars indicate s.d. *p < 0.05. (f) Graph showing the percentage of immunostained sections of Ctrl, shEZH2 and shEZH2 + shp21 that presents the indicated phenotypes. (g) Transversal sections of neural tubes from HH11–12 embryos electroporated in ovo with pCIG vector (Ctrl), pCIG together with p21WAF1/CIP1 or cytoplasmic p21WAF1/CIP1 (p21-ΔNLS) and stained with DAPI and N-cadherin 48 h PE. Ectopic lumens are amplified. Mitotic cells at the new lumens are visualized by DAPI staining (yellow arrows). The data are representative of at least three independent experiments. (h) HH11–12 embryos were electroporated in ovo with shCtrl, shp21, shEZH2 or shEZH2 and shp21 together with pSRE-luc plasmid and β-gal reporter used as internal control; 48 h later the neural tubes were dissected, the tissue was disaggregated and the luciferase activity measured using the Life Technologies dual kit. Data represent mean of three experiments from five to seven embryos. Error bars indicate s.d. *p < 0.05; ***p < 0.001. (i) 293 T cells were transfected with RhoA-V14, p21WAF1/CIP1 or RhoA-V14 and p21WAF1/CIP1 expression vectors together with pSRE-luc plasmid and β-gal reporter used as internal control. 24 h later the luciferase activity measured using the Life Technologies dual kit. Data represent mean of four experiments. Error bars indicate s.d. **p < 0.01; ***p < 0.001.

