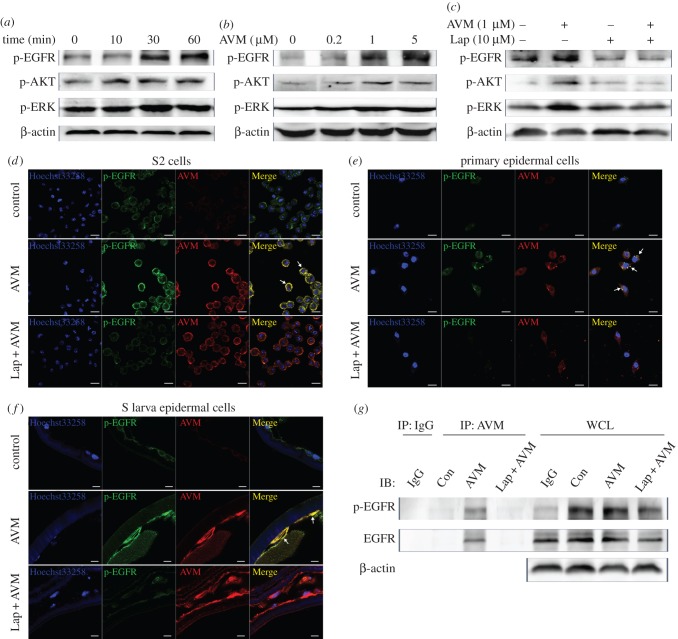
Figure 6.
AVM directly interacts with EGFR and activates EGFR/AKT/ERK signalling pathway. (a–c) The protein levels of p-EGFR, p-AKT and p-ERK in S2 cells treated with 1 µM avermectin (AVM) for different times (a), 0–5 µM AVM for 30 min (b) or 1 µM AVM for 30 min plus 10 µM lapatinib (Lap) pretreatment for 120 min (c). (d–f) The co-localization of AVM with p-EGFR was detected by immunofluorescence. The S2 cells (d), primary Drosophila epidermal cells (e) and avermectin-susceptible larvae (S; f) were treated with 1 µM AVM for 30 min (d,e) or 1 h (f) with or without pretreatment with 10 µM lapatinib for 120 min. Blue: nuclei stained by Hoechst33258; green: target proteins; red: AVM (scale bar, 10 µm). (g) The interactions of AVM with EGFR and p-EGFR were determined by co-immunoprecipitation assay in S2 cells. ‘IP’ indicates cell lysates immunoprecipitated with non-specific IgG or anti-AVM antibody. ‘Con’, ‘AVM’, ‘Lap + AVM’ indicates cells treated with vehicle, 1 µM AVM for 30 min and 1 µM AVM for 30 min plus 10 µM lapatinib pretreatment for 120 min, respectively. ‘IgG’ indicates the vehicle-treated cell lysates immunoprecipitated with non-specific IgG. ‘WCL’ indicates the whole cell lysates.

