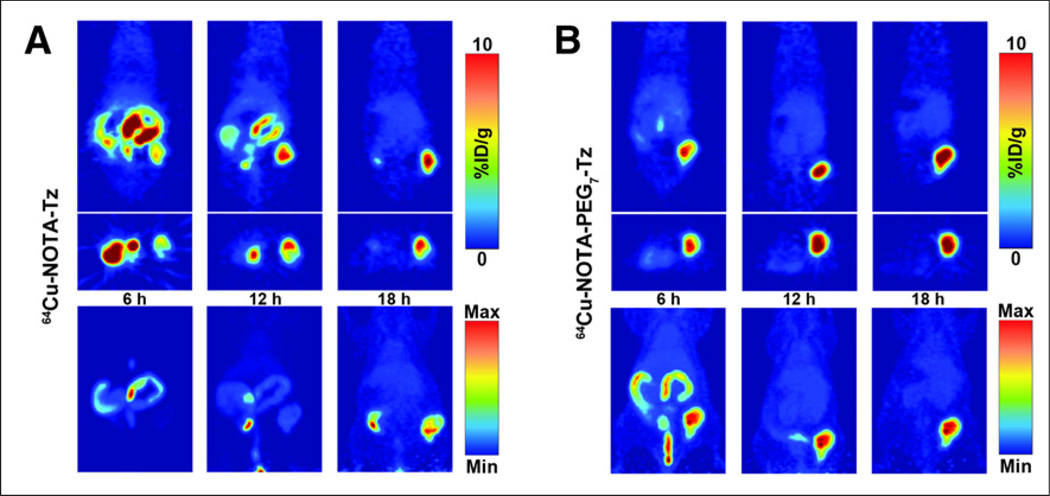
FIGURE 3.
Serial PET imaging of mice bearing subcutaneous BxPC3 xenografts on right flank that were injected with either 64Cu-NOTA-Tz (A) or 64Cu-NOTA-PEG7-Tz (B) 72 h after injection of 5B1-TCO. Tomographic slices bisecting tumor (top) and maximum-intensity projections (bottom) are shown for same representative mice. %ID/g = percentage injected dose/gram; Max = maximum; Min = minimum.

