Fig. 3.

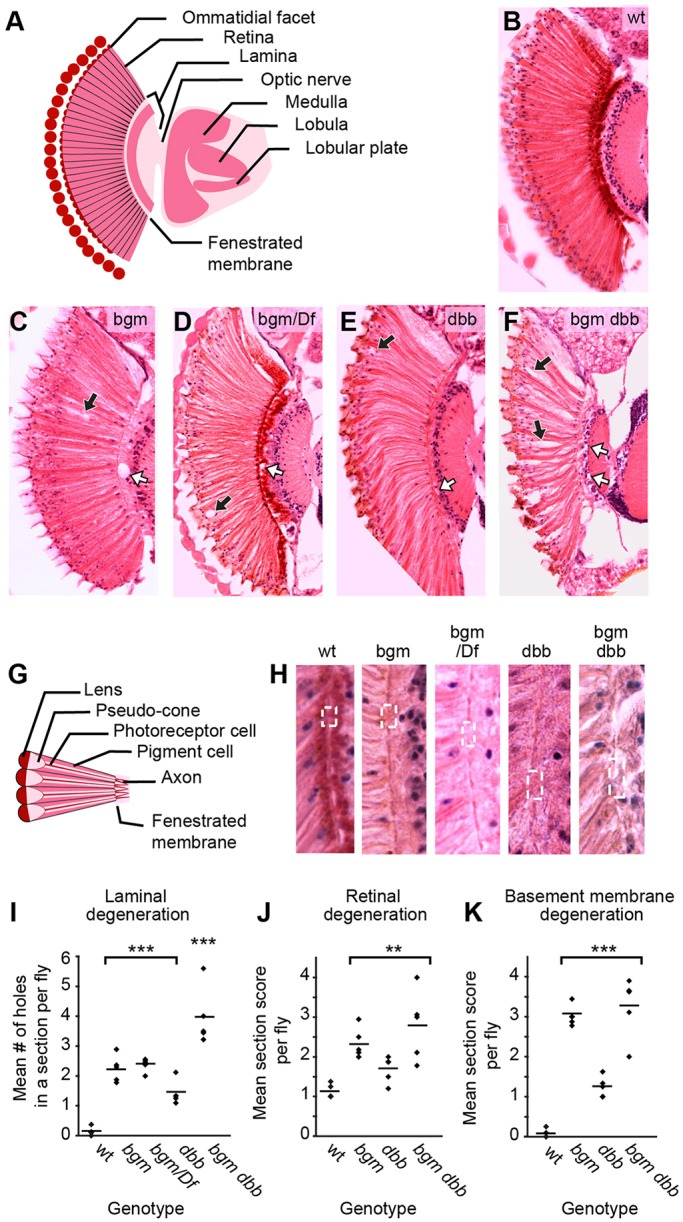
Degeneration of the CNS in acyl-CoA synthetase mutants. (A) Labeled schematization of a Drosophila brain horizontal section. (B-F) H&E-stained brain sections representative of wild-type, bgm1, bgm1/Df(2L)b87e25, dbb1 and bgm1 dbb1 animals, respectively. In C-F, retinal degeneration is marked by black arrows and laminal degeneration by white arrows. (G) Labeled schematization of a horizontal section of the Drosophila retina. (H) Magnified fenestrated membranes from animals shown in B-F. Note the enlarged portals (dashed boxes, containing in the case of the bgm dbb double mutant displaced retinal nuclei). (I-K) Degeneration in (I) lamina and (J) retina, as well as (K) defects in the fenestrated basement membrane, were quantified. For these plots, data obtained from analysis of H&E brain sections were analyzed by ANOVA and by the Welch two-sample t-test. Each point represents the mean score per animal; horizontal lines represent the mean score per genotype. Statistical significance determined by ANOVA followed by Student's t-test: ***P<0.001, **P≤0.015. wt, wild type.
