Fig. 2.
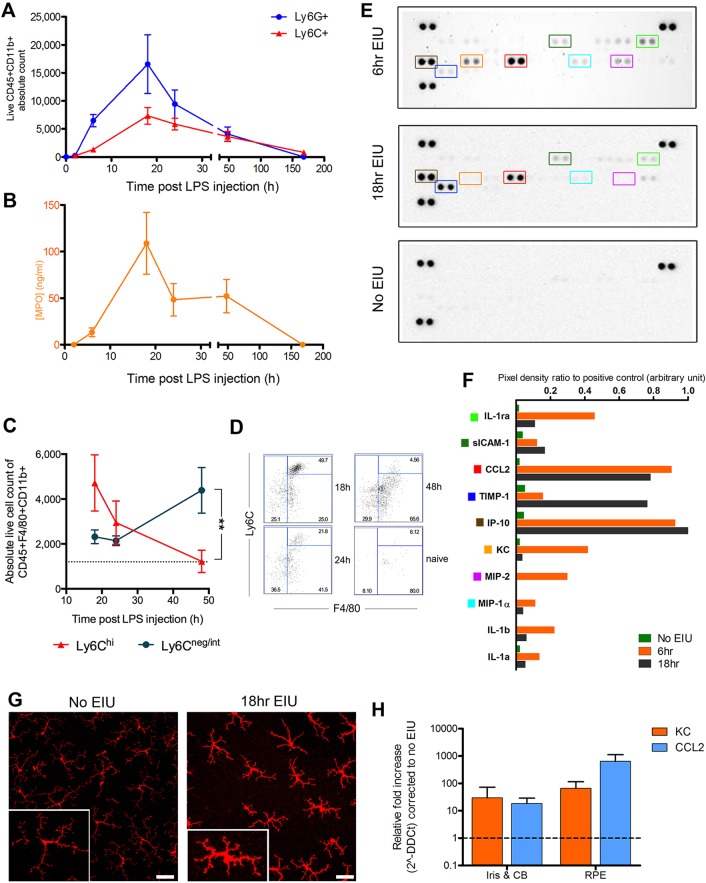
Multimodal analysis characterises dynamic and plastic changes in infiltrating cells, protein levels and resident tissues during EIU. Following intravitreal injection of 1 ng lipopolysaccharide (LPS), eyes were analysed by flow cytometry 2, 6, 18, 24, 48 and 168 h later. (A) The peak of CD45+CD11b+Ly6G+ (neutrophil) and CD45+CD11b+Ly6C+ (monocyte) cell numbers was at 18 h, with no infiltration seen at 2 h. By 7 days, cell numbers had returned to baseline. n=8 eyes per point, except at 6, 18 and 24 h, where n=22. (B) Myeloperoxidase (MPO) levels in supernatants from the same eyes used for flow cytometry reached peak level at 18 h. n=5 eyes per point. Connecting lines are for ease of interpretation and do not represent repeated measures upon the same eyes. Means±s.e.m. are shown. Single proteome profilers evaluated pooled supernatants from six dissociated eyes at each time point. (C) Flow cytometry analysis of F4/80 and Ly6C surface staining during the post-peak resolution phase of leukocyte infiltration, illustrating changes in the infiltrate composition with (D) representative cytometry plots. Data from two independent experiments; means±s.e.m. are shown. **P=0.003 at 48 h, Mann–Whitney U-test. n=8-11 eyes per point. (E) Developed images of R&D Mouse Cytokine Panel A membranes testing pooled supernatants from six eyes. Further representative examples are in Fig. S3. Key targets are outlined with coloured boxes, which correspond to the same coloured square markers listed in F. (F) Densitometry quantification of selected proteins from the representative membranes shown in E. (G) Retinal flat-mounts stained for Iba-1 (red) show increased intensity alongside morphological changes in microglia populations, consistent with cell activation. Scale bars: 30 μm. Magnified example: inset, bottom left. In addition to infiltrating cells, resident cells might produce several cytokine/chemokines and as shown in H. (H) Residual tissues from the same group of eyes can be examined by qPCR and show elevated levels of KC and CCL2 relative to no-EIU controls. n=3 eyes per group; technical triplicates at 18 h post-induction; means±s.d. are shown. CB, ciliary body; RPE, retinal pigment epithelium.

