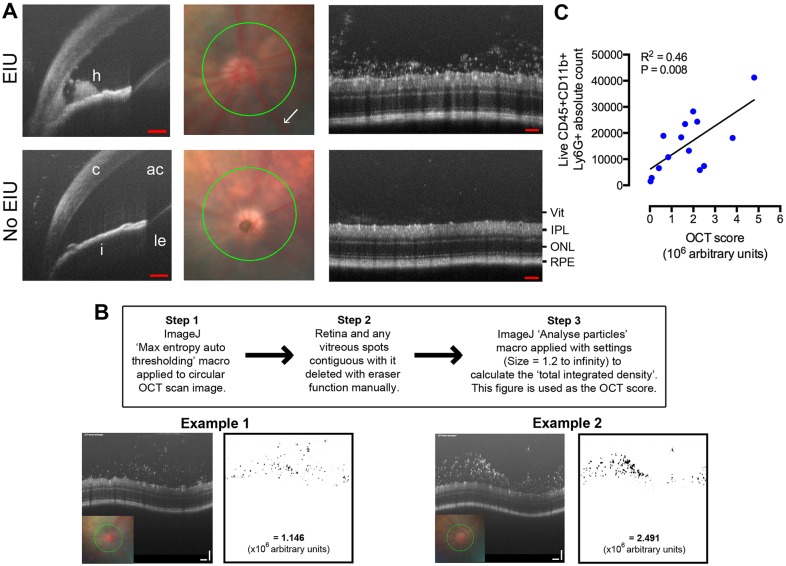
Fig. 4.
In vivo EIU assessment using OCT correlates with flow-cytometry-based counts. 18 h after lipopolysaccharide (LPS) administration, eyes were imaged by OCT. (A) Hypopyon and static aggregations of cells in the anterior chamber (AC) could be detected. Circular scans (green) were centred on the optic disc using fundus images and the vitreous infiltrate scored. Vascular dilatation can be seen in EIU eyes (white arrow and Fig. S4). h, hypopyon; c, cornea; i, iris; ac, anterior chamber; le, lens; vit, vitreous cavity; IPL, inner plexiform layer; ONL, outer nuclear layer; RPE, retinal pigment epithelium. Scale bars: 100 μm. (B) Method and worked examples of OCT score calculation using ImageJ software (Rasband, W. S., ImageJ, US National Institutes of Health, Bethesda, MD, USA, imagej.nih.gov/ij/, 1997-2012). (C) After imaging, eyes were dissected, processed by flow cytometry and a statistically significant correlation to their in vivo OCT scores were demonstrated. R2=0.46, P=0.008, n=14, Pearson correlation. Linear regression is shown.

