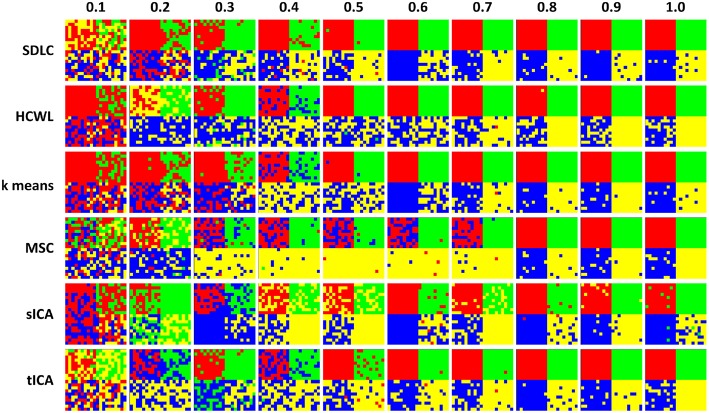
Figure 3.
Clustering results for the first simulation. Each row is the clustering results for each of the six techniques tested, namely: SDLC, hierarchical clustering with ward linkage (HCWL), k-means clustering, multi-class spectral clustering (MSC), spatial ICA (sICA) and temporal ICA (tICA). Signal to noise ratio of each column is labeled at the top of the figure. Columns from left to right have increasing signal to noise ratios.

