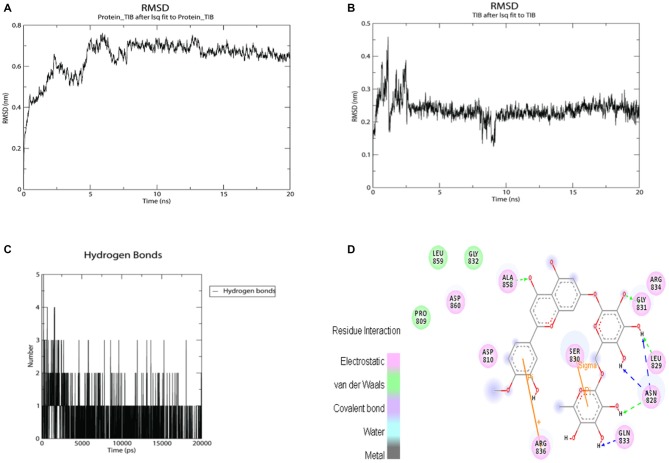
Figure 9.
MMPBSA simulation results for the complex SUR1 with hesperidin and 2D interaction map. (A) RMSD fluctuations for SUR1-Hesperidin complex; (B) RMSD fluctuations for hesperidin; (C) hydrogen bonds fluctuations for hesperidin inside SUR1 active site; (D) 2D interaction map for hesperidin inside SUR1 active pocket.

