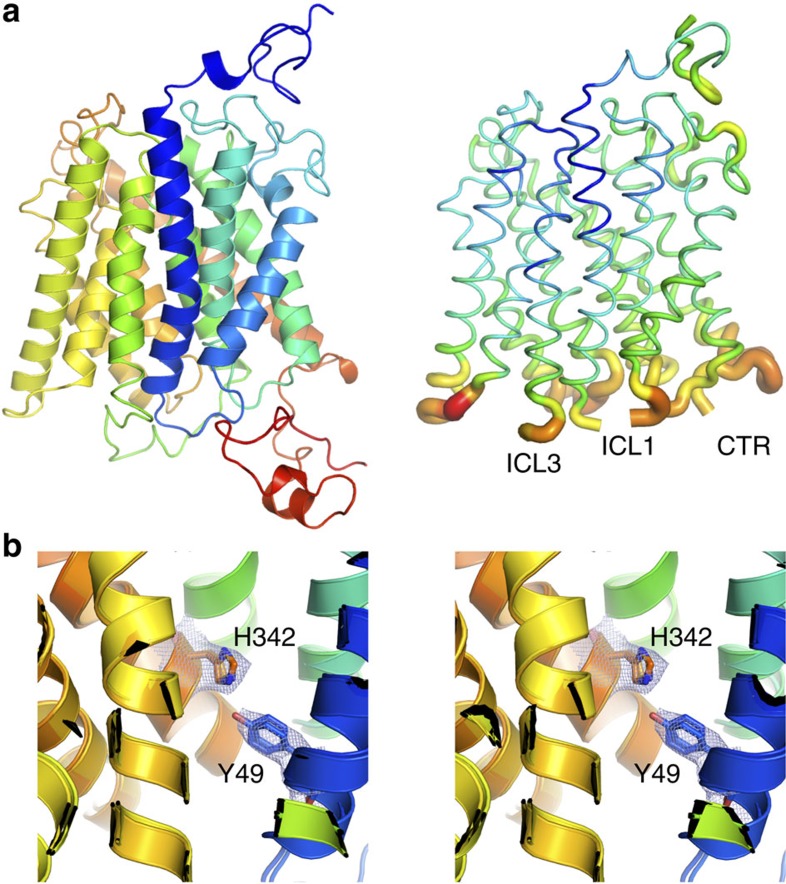
Figure 7. Effect of removal of the AI region on Mep2 structure.
(a) Side views for WT CaMep2 (left) and the truncation mutant 442Δ (right). The latter is shown as a putty model according to B-factors to illustrate the disorder in the protein on the cytoplasmic side. Missing regions are labelled. (b) Stereo superpositions of WT CaMep2 and the truncation mutant. 2Fo–Fc electron density (contoured at 1.0 σ) for residues Tyr49 and His342 is shown for the truncation mutant.

