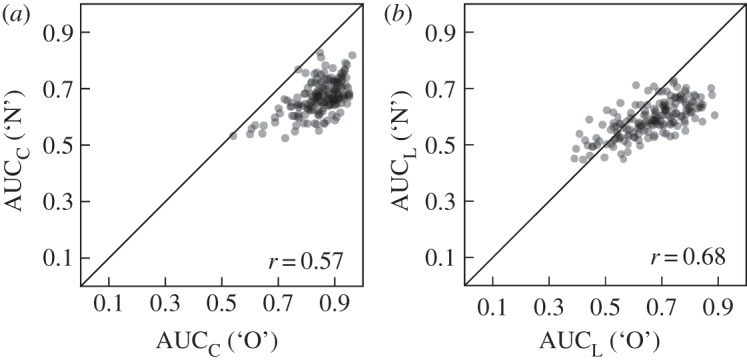
Figure 4.

Scatter-plots comparing areas under the ‘old’ (‘O’) and ‘new’ (‘N’) ROC functions (AUC) for confidence ratings (C; (a)) and response latency (L; (b)). Corresponding correlations and the main diagonal are indicated in each panel. Individual data points are transparent such that darkness indicates density of points in a given area.
