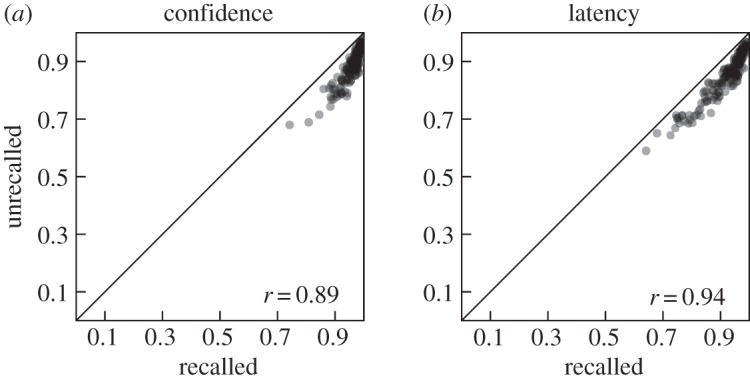
Figure 6.

Scatter-plots comparing areas under the ROC functions for targets that were previously recalled and those that were previously unrecalled within each session (the same set of lures were used in the generation of both ROC functions). Separate scatter-plots are shown for ROC functions based on confidence ratings (a) versus response latency (b). Corresponding correlations and the main diagonal are indicated in each panel. Individual data points are transparent such that darkness indicates density of points in a given area.
