
Figure 2.
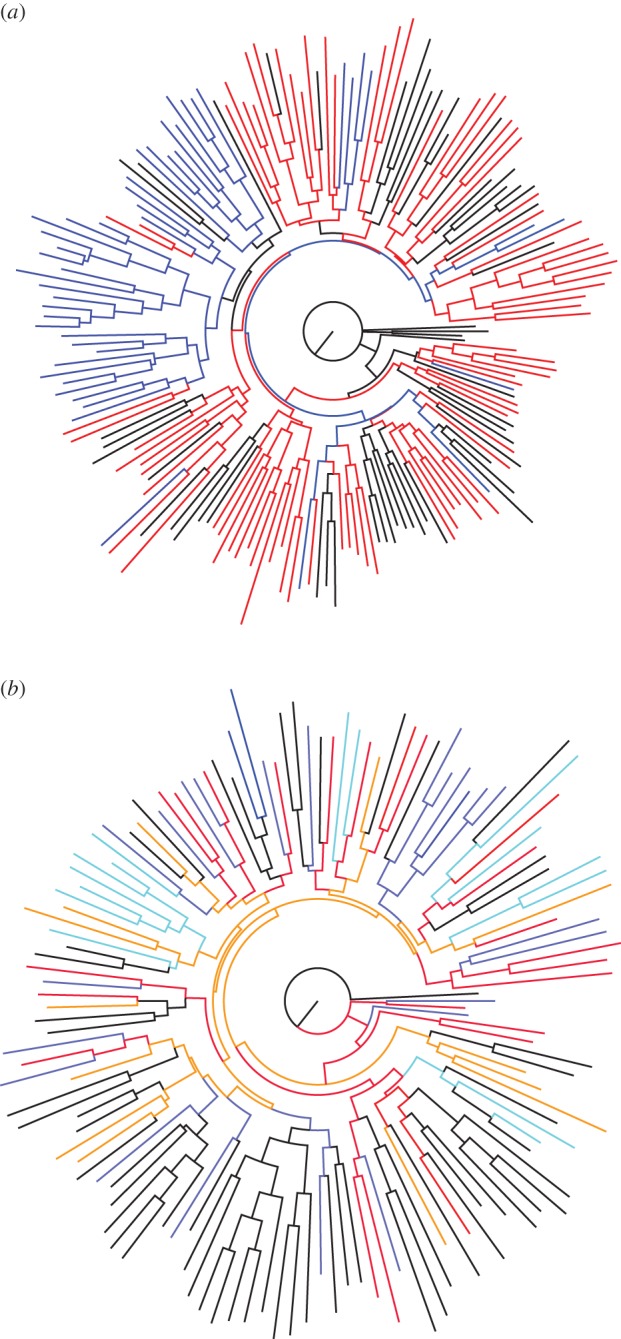
(a) Neighbour-joining tree of all Henderson and Pitcairn rats. The tree was constructed using a distance matrix of 1 – R, where R is relatedness sensu Queller and Goodnight. For clarity, individual rats are colour coded: blue, Pitcairn; black, Henderson pre-eradication attempt; red, Henderson post-eradication attempt. (b) The neighbour-joining tree of Henderson rats, according to trapping location and period. Red, North Beach pre-eradication; orange, North Beach post-eradication; dark blue, East Beach pre-eradication; light blue, East Beach post-eradication; black, plateau post-eradication.