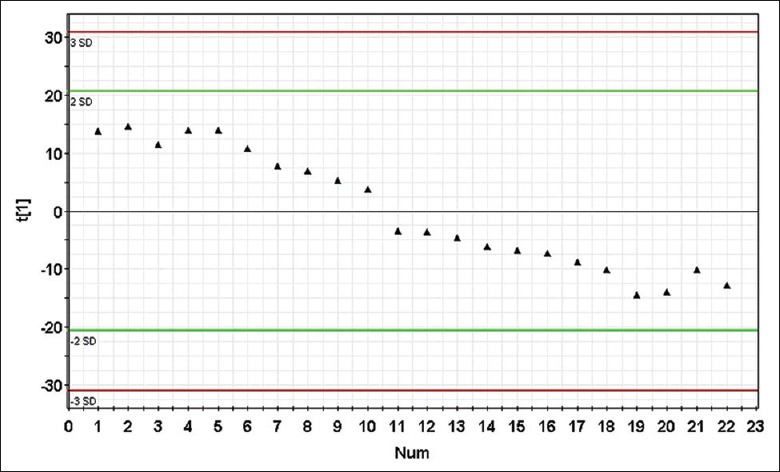
Figure 2.

Score plot of principal component [t(1)] for quality control principal component analysis model. Each point represents a quality control sample. The detection system was stable throughout the experiment after the first 10 quality control samples were injected (no outliers exceeding ± 2 standard deviation were detected in the quality control samples), the icon of t(1) represents the first principal component.
