
Figure 1.
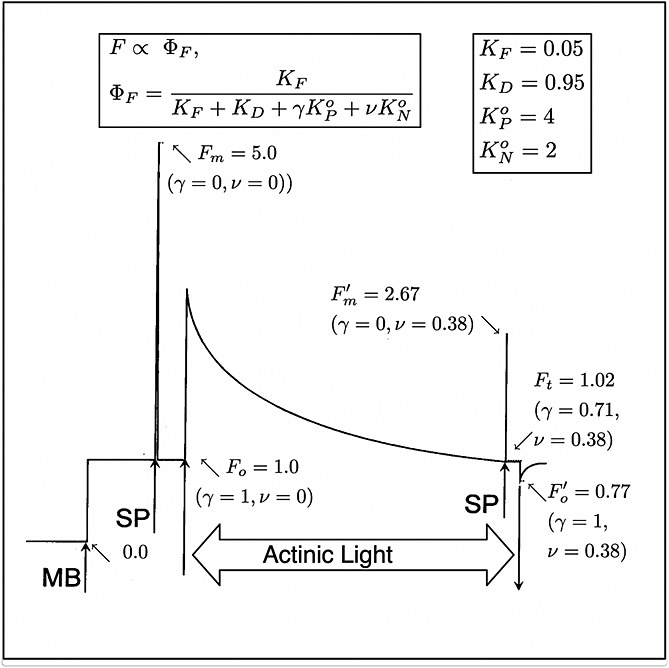
A sample trace of a measurement of fluorescence from a leaf with a PAM fluorometer [after Maxwell and Johnson, 2000]. The measuring light is turned on at MB; saturating pulses (1 s) are applied at SP. Note that γ→0 during a SP while ν is unchanged. The experiment shows changes in fluorescence that occur when actinic light is provided. The fluorescence levels (F) are normalized to the Fo level. The photochemical yield of the leaf under dark adapted conditions  and after a period of illumination
  . These arbitrary fluorescence levels can be related to absolute yields with the equations and probability constants shown in the boxes and the values of γ and ν. We used equations (8) and (9) to estimate KN and KP, respectively, and
  and
and  .
.