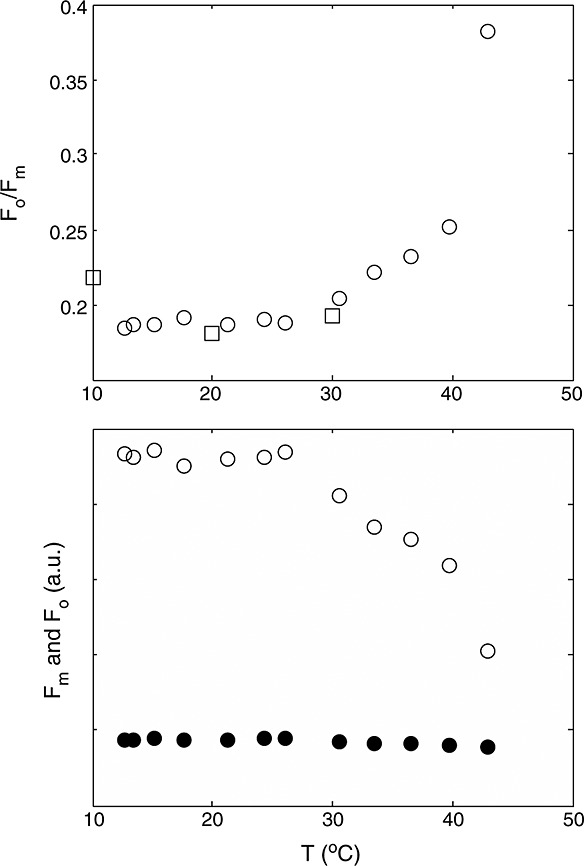
Figure 4.

(top) Measurements of Fo/Fm at different temperatures for the cotton experiment (circles) and the tobacco experiment (squares). (bottom) Fm (open symbols) and Fo (closed symbols) at different temperature for the cotton experiment. Note that the values are relative, and the unit on the y axis is arbitrary
