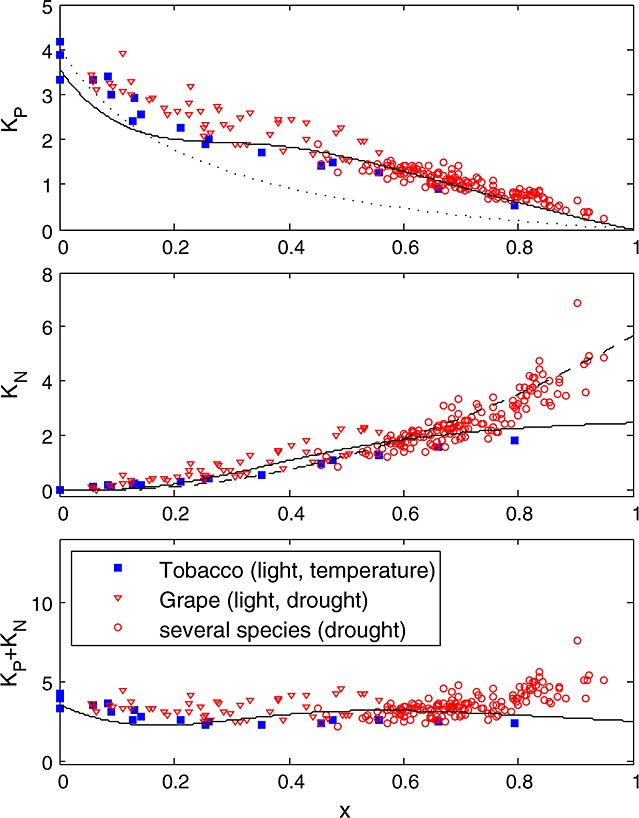
Figure 6.

Similar to Figure 5 but for the other experiments: (1) tobacco leaves under different temperature and illumination and (2) grape and other C3 species subject to a drought experiment under full sunlight. The solid line represents the empirical fit of the cotton experiment, and the dashed line is calibrated to the drought experiment data.
