Figure 7.

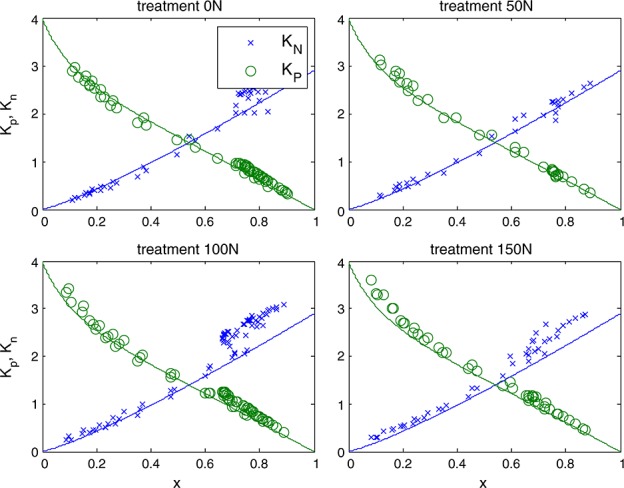
Responses of KP (green) and KN for four different nitrogen treatments in maize (symbols). The lines represent the empirical fit for the cotton experiment.

Responses of KP (green) and KN for four different nitrogen treatments in maize (symbols). The lines represent the empirical fit for the cotton experiment.