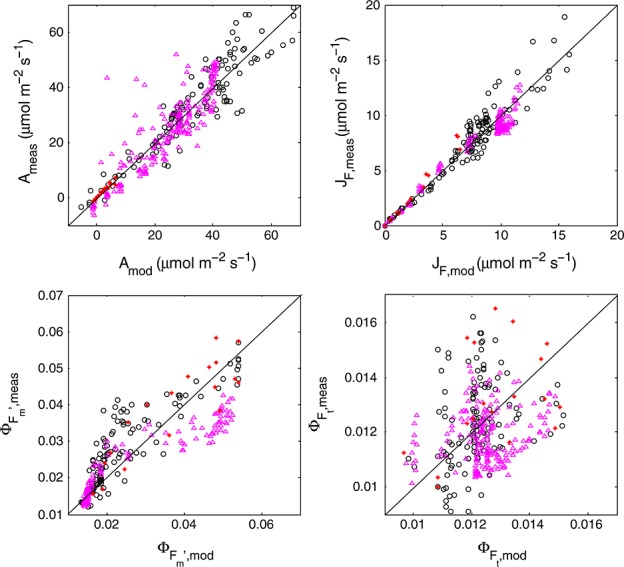
Figure 8.

Modeled versus measured photosynthesis A, fluorescence flux  , steady state fluorescence yield
  , and maximum fluorescence yield
  (clockwise). Circles refer to cotton, triangles to maize, and stars to tobacco.

Modeled versus measured photosynthesis A, fluorescence flux  , steady state fluorescence yield
  , and maximum fluorescence yield
  (clockwise). Circles refer to cotton, triangles to maize, and stars to tobacco.