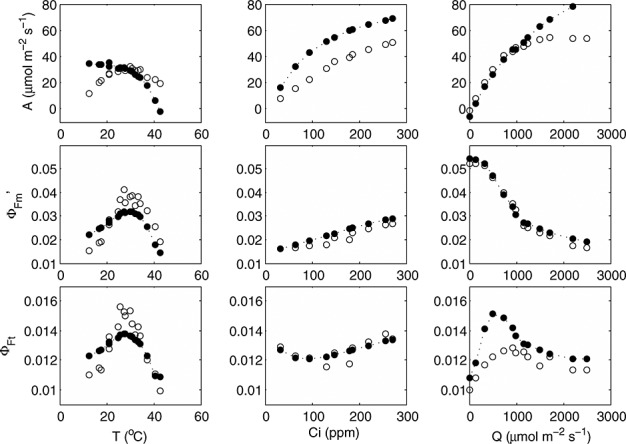
Figure 9.

Measured (open symbols) and modeled (closed symbols) responses of photosynthesis, maximum fluorescence yield, and steady state fluorescence yield of selected cotton leaves to temperature, leaf boundary layer CO2 concentration, and irradiance.
