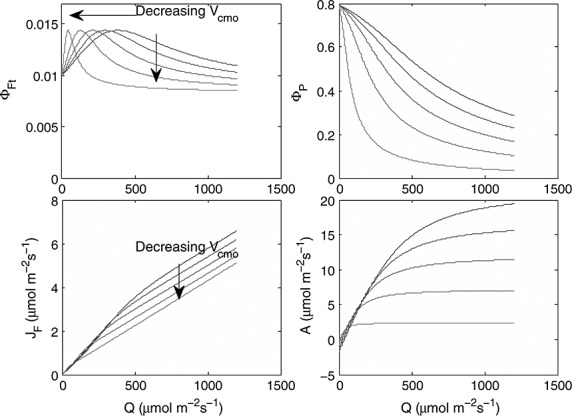
Figure 12.

(top left) Modeled fluorescence yield ΦFt (top right)photochemical yield ΦP, (bottom left) photosynthesis A, and (bottom right) fluorescence flux JF, as functions of irradiance for the following values of maximum carboxylation capacity Vcmo: 10 (light gray), 30, 50, 70, and 90 (black) μmol m−2 s−1. The drought relation between x and KN was used.
