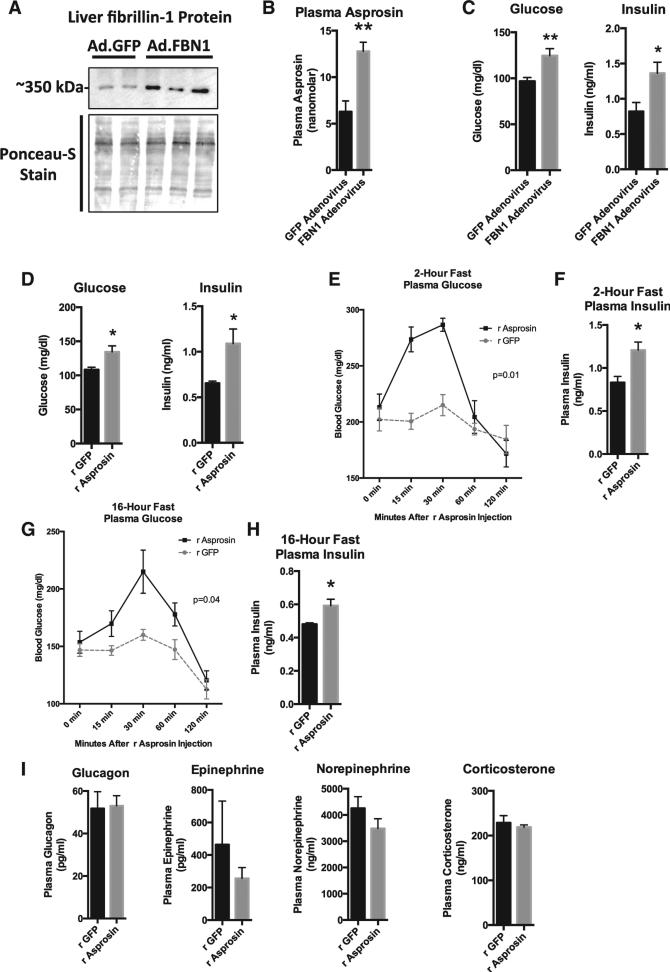
Figure 3. Increase in Circulating Asprosin Is Associated with Elevated Blood Glucose and Insulin in Mice.
(A) Profibrillin (350 kDa) immunoblot on liver lysates 10 days after WT mice were subjected to a onetime tail vein injection of 1011 viral particles of adenovirus carrying cDNA for FBN1 (lanes 3, 4, and 5) or GFP (lanes 1 and 2). Mice were subjected to a 2-hr fast for synchronization prior to sacrifice.
(B) Sandwich ELISA was used to measure plasma asprosin levels from mice in (A) (n = 5 in each group).
(C) Plasma glucose and insulin levels from mice in (A) (n = 5 in each group).
(D) Plasma glucose and insulin levels were measured 10 days after WT mice were subjected to daily subcutaneous injection of 30 mg recombinant asprosin (validated to result in a 50 nM peak plasma level) or recombinant GFP for 10 days (n = 5 in each group).
(E) Plasma glucose was measured at the indicated times after a single 30 μg dose of subcutaneous recombinant asprosin or GFP in mice that had been subjected to a 2-hr fast prior to injection (n = 6 in each group). Two-way ANOVA with Bonferroni post test was used to calculate the p value.
(F) Plasma insulin was measured 15 min after injection from mice in (E) (n = 6 in each group).
(G) Plasma glucose was measured at the indicated times after a single 30 μg dose of subcutaneous recombinant asprosin or GFP in mice that had been subjected to an overnight (~16 hr) fast prior to injection (n = 6 in each group). Two-way ANOVA with Bonferroni post test was used to calculate the p value.
(H) Plasma insulin was measured 30 min after injection from mice in (G) (n = 6 in each group).
(I) Plasma glucagon, catecholamines, and corticosterone were measured 15–20 min after a single 30 μg dose of subcutaneous recombinant asprosin or GFP in mice that had been subjected to a 2-hr fast prior to injection (n = 6 in each group).
Data are represented as the mean ± SEM.

