Fig. 1.
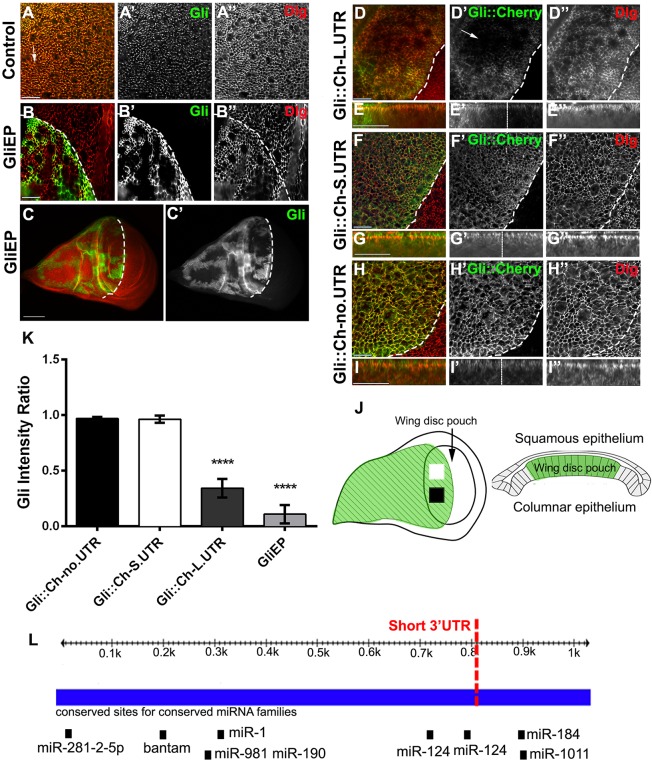
Overexpression of Gliotactin causes self-downregulation. (A) The expression pattern of Gliotactin in a wild-type wing imaginal disc, immunolabelled for Gliotactin (green, A′) and Dlg (red, A″). Gliotactin was concentrated at the tricellular junction (arrow) and Dlg at the septate junction. (B–H) apterous-GAL4-driven expression of Gliotactin transgenes within the wing imaginal disc. The dashed line marks the dorsal–ventral boundary with the dorsal apterous side of the wing imaginal disc to the left. (B,C) High- (B) and low- (C) resolution images of a wing imaginal disc with overexpression of endogenous Gliotactin (green, B′,C′) from an EP (UAS) insertion in Gliotactin. Gliotactin was downregulated in a patchy manner, whereas Dlg was not (red, B”). (D) Overexpression of a Gliotactin transgene with the full-length 3′UTR (Gli::Ch-L.UTR) (green, D′) was downregulated (arrow) in regions within the apterous side, whereas Dlg (red, D″) was not. (F–I) Overexpression of Gliotactin with the short 3′UTR (Gli::Ch-S.UTR) or a Gliotactin transgene without a 3′UTR (Gli::Ch-no.UTR). Neither Gliotactin (green, F′,H′) nor Dlg (red, F″,H″) were downregulated. (E,G,I) Side views of the corresponding panels above. (J) Diagram of wing imaginal disc. Fluorescence intensity was measured in two separate areas (squares) in the wing pouch of the apterous side of the imaginal disc (green). A side view of the disc shows the position of the columnar epithelia within the wing pouch. (K) The fluorescence intensity ratio (apterous to wild-type side) of Gli::Ch-L.UTR and GliEP was significantly downregulated in regions across the apterous expression domain compared to the lack of downregulation of Gli::Ch-S.UTR or Gli::Ch-no.UTR (n=10 discs, ****P<0.0001, mean±s.d., one-way ANOVA). (L) The Gliotactin 3′UTR, indicating the conserved miRNA-target sites. Sites for miR-281, bantam, miR-1, miR-981, miR-190, miR-124, miR-1011 and miR-184 are shown, and the dotted line indicates the border of the short and full-length of 3′UTRs observed in Gliotactin-expressed sequence tags. Scale bars: 15 μm (all images except C); 50 μm (C).

