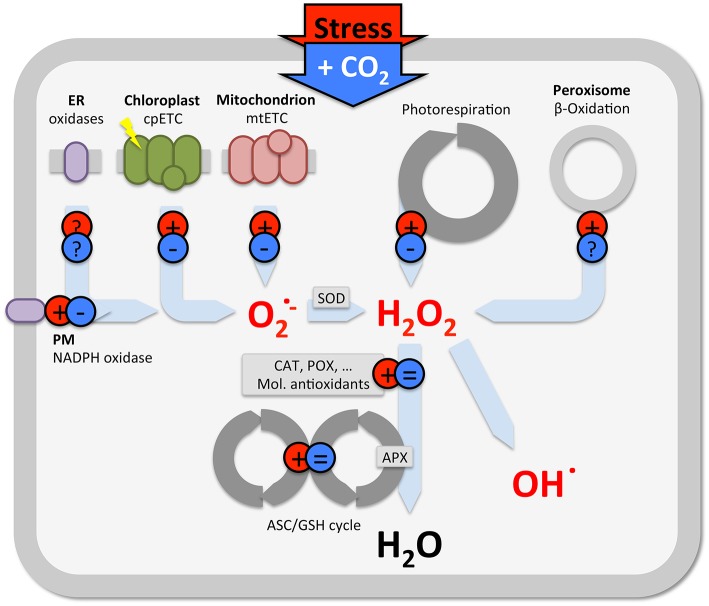
Figure 2.
Schematic view summarizing the predominant effect of stress (red) and elevated CO2 (blue) on ROS production in various subcellular locations. Note, there is considerable variety in the outcome of studies on antioxidants (see text), only the predominant effects are indicated in this generalization.

