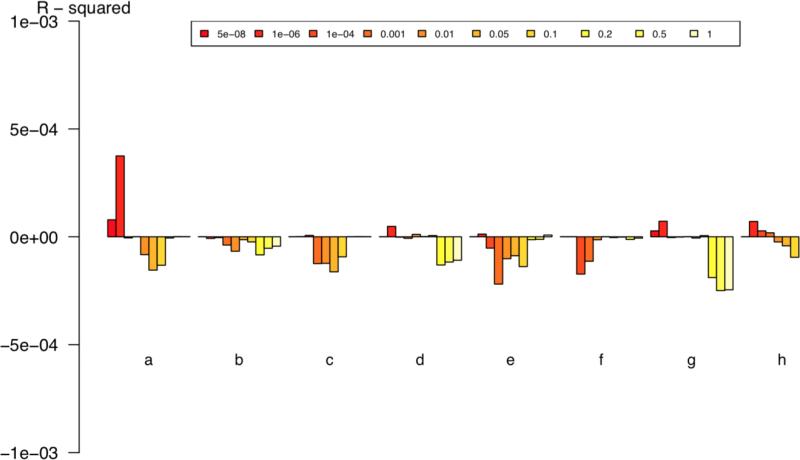
Figure 1.
Genetic predisposition score analyses examining the predictive capacity of ENIGMA brain volumetric results on schizophrenia case-control status using different P-value thresholds. X-axis: (a) hippocampus, (b) ICV, (c) nucleus accumbens, (d) amygdala, (e) caudate nucleus, (f) pallidum, (g) putamen, (h) thalamus. Y-axis shows Nagelkerke's R2. Positive values indicate SNP effects for increasing brain structure volume and increased risk for schizophrenia. Negative values indicate SNP effects for decreasing brain structure volume in and increased risk for schizophrenia. Significance values are given in Table 2.

