Figure.

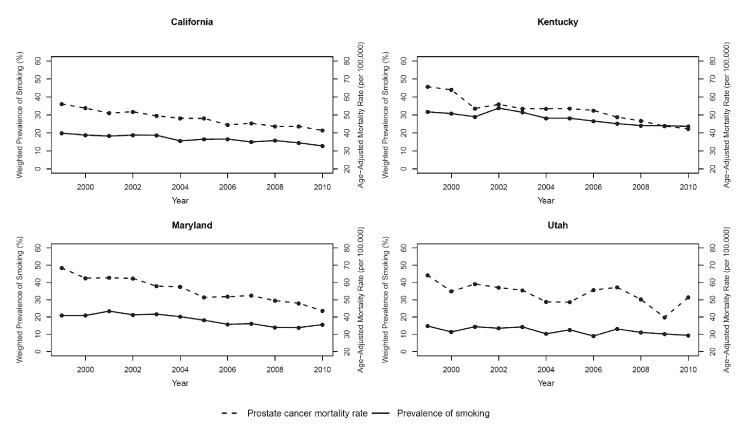
Trends in cigarette smoking and prostate cancer mortality rates among men aged 35 years or older, Behavioral Risk Factor Surveillance System and CDC WONDER, 1999–2010. Solid lines represent trends in the weighted prevalence of cigarette smoking among men aged 35 years or older, and dashed lines represent trends in age-adjusted prostate cancer mortality rates for men aged 35 years or older. Abbreviation: CDC WONDER, Centers for Disease Control and Prevention’s Wide-Ranging Online Data for Epidemiologic Research.
| Year | Weighted Prevalence of Cigarette Smoking, % |
Age-Adjusted Prostate Cancer Mortality Rate (per 100,000) |
||||||
|---|---|---|---|---|---|---|---|---|
| California | Kentucky | Maryland | Utah | California | Kentucky | Maryland | Utah | |
| 1999 | 19.9 | 31.7 | 20.9 | 14.8 | 56.1 | 65.7 | 68.4 | 64.2 |
| 2000 | 18.8 | 30.8 | 20.9 | 11.4 | 53.8 | 64.0 | 62.5 | 54.9 |
| 2001 | 18.3 | 29.0 | 23.4 | 14.4 | 51.0 | 53.6 | 62.7 | 59.1 |
| 2002 | 18.8 | 33.8 | 21.3 | 13.5 | 51.8 | 55.9 | 62.4 | 57.1 |
| 2003 | 18.7 | 31.5 | 21.7 | 14.3 | 49.5 | 53.5 | 57.9 | 55.5 |
| 2004 | 15.6 | 28.2 | 20.2 | 10.3 | 48.2 | 53.5 | 57.5 | 48.8 |
| 2005 | 16.5 | 28.2 | 18.2 | 12.6 | 48.1 | 53.6 | 51.4 | 48.6 |
| 2006 | 16.6 | 26.6 | 15.8 | 9.0 | 44.5 | 52.5 | 51.8 | 55.7 |
| 2007 | 15.0 | 25.2 | 16.2 | 13.1 | 45.4 | 48.8 | 52.4 | 57.2 |
| 2008 | 15.8 | 24.1 | 14.0 | 11.1 | 43.6 | 46.7 | 49.5 | 50.2 |
| 2009 | 14.5 | 24.0 | 13.9 | 10.2 | 43.7 | 43.8 | 48.0 | 39.8 |
| 2010 | 12.8 | 23.7 | 15.6 | 9.4 | 41.4 | 42.3 | 43.6 | 51.4 |
