Fig. 5.
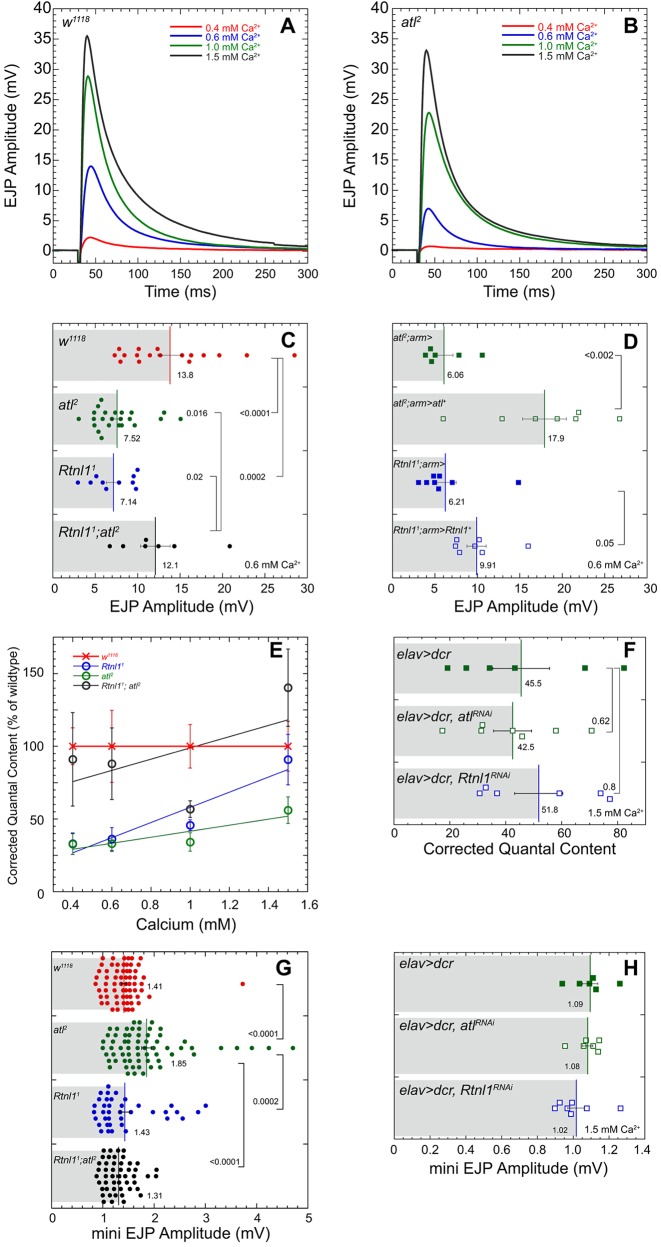
atl2 and Rtnl11 decrease evoked neurotransmitter release. Average EJP traces for wild-type (w1118) (A) and atl2 (B) larvae at 0.4, 0.6, 1.0, and 1.5 mM Ca2+. In ascending [Ca2+], for w1118 n=7, 17, 7, and 7 and for atl2 n=7, 23, 7, and 7. (C) Mean±s.e.m. EJP amplitude for w1118, atl2, Rtnl11, and Rtnl11; atl2. P-values shown represent a one-way ANOVA using a Fisher's LSD post hoc test performed with KaleidaGraph. (D) Mean±s.e.m. EJP amplitude for atl2; arm>UAS-atl+, Rtnl11; arm>UAS-Rtnl1+, and their respective controls using the ubiquitous arm-Gal4 driver. P-values shown represent an unpaired Student's t-test performed with KaleidaGraph. Recordings for C and D were performed at 0.6 mM Ca2+. (E) Mean±s.e.m. corrected quantal content for w1118, Rtnl11, atl2, and Rtnl11; atl2. In ascending [Ca2+], w1118 n=7, 17, 7, and 7; atl2 n=7, 23, 7, and 7; Rtnl11 n=7, 10, 7, and 7; Rtnl11; atl2 n=7, 7, 7, and 7. Resting membrane potentials (RMPs) were not significantly different among the four genotypes at bath [Ca2+] of 0.4 mM or 1.5 mM. At bath [Ca2+] of 0.6 mM or 1.0 mM, RMPs of wild-type and atl2 were significantly different (P=0.0266, wild-type more hyperpolarized, at 0.6 mM [Ca2+], and P=0.0316, atl2 more hyperpolarized, at 1.0 mM [Ca2+]). RMP of Rtnl11; atl2 was significantly different from other genotypes at a bath [Ca2+] of 1.0 mM, Rtnl11; atl2 more hyperpolarized. (F) Mean±s.e.m. corrected quantal content for elav>dcr, elav>dcr, atlRNAi, and elav>dcr, Rtnl1RNAi at 1.5 mM [Ca2+]. (G) Mean±s.e.m. mEJP amplitudes for w1118, atl2, Rtnl11, and Rtnl11; atl2, pooled from all four [Ca2+]. (H) Mean±s.e.m. mEJP amplitudes for the indicated genotypes collected at 1.5 mM bath [Ca2+]. P-values in D,F,G represent an unpaired Student's t-test performed with KaleidaGraph. Recordings were performed in HL3 from muscle 6 in segment A6. Each scattergram data point is the average of the first 20 EJP responses (successes and failures) recorded for each larva.

