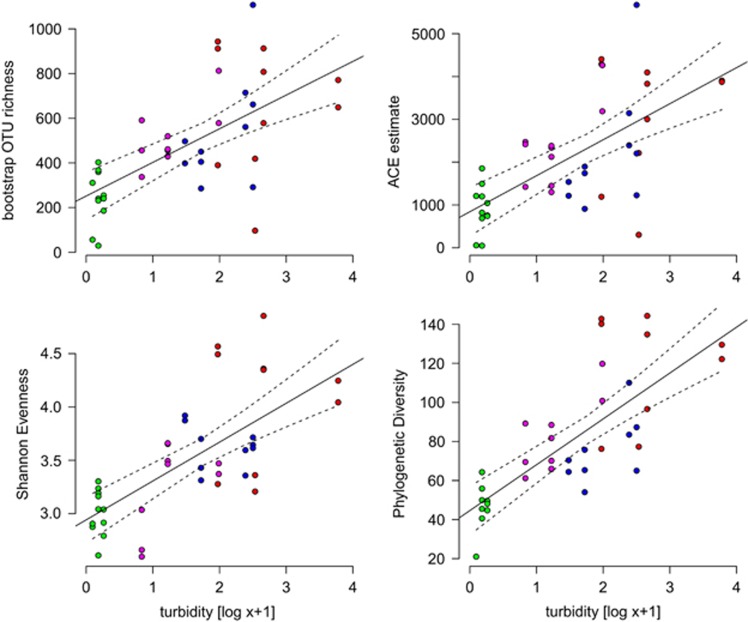
Figure 2.
Indices used to describe alpha diversity of bacterial assemblages in lakes along a turbidity gradient (colors same as in Figure 1). Shown are bootstrapped OTU richness, abundance-based coverage estimate (ACE), the nonparametric Shannon evenness index, and Faith's PD. Colors are the same as in Figure 1. Solid lines indicate linear model fits between turbidity (log x+1) and the respective alpha diversity estimate. Dashed lines represent the 95% confidence intervals of the model fits.

