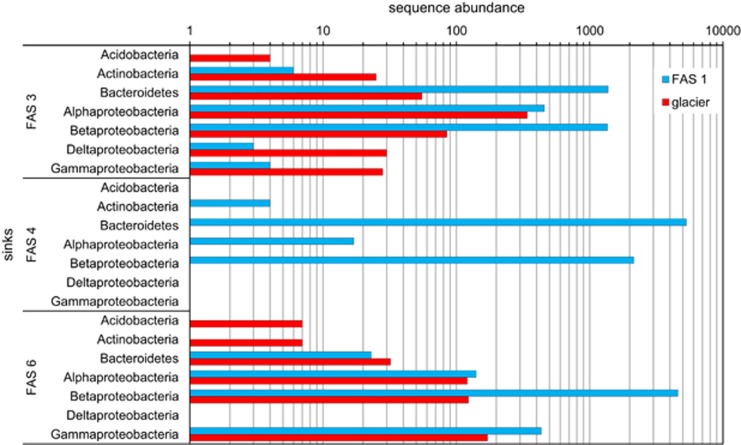
Figure 3.
Results of the Bayesian mixing model using the glacier runoff and the uppermost turbid lake FAS 1 as sources to the connected downstream turbid lakes FAS 3 and FAS 6 and the unconnected clear lake FAS 4 (sinks). Bars represent sequence abundance binned by phylogenetic class affiliation for significant taxa.

