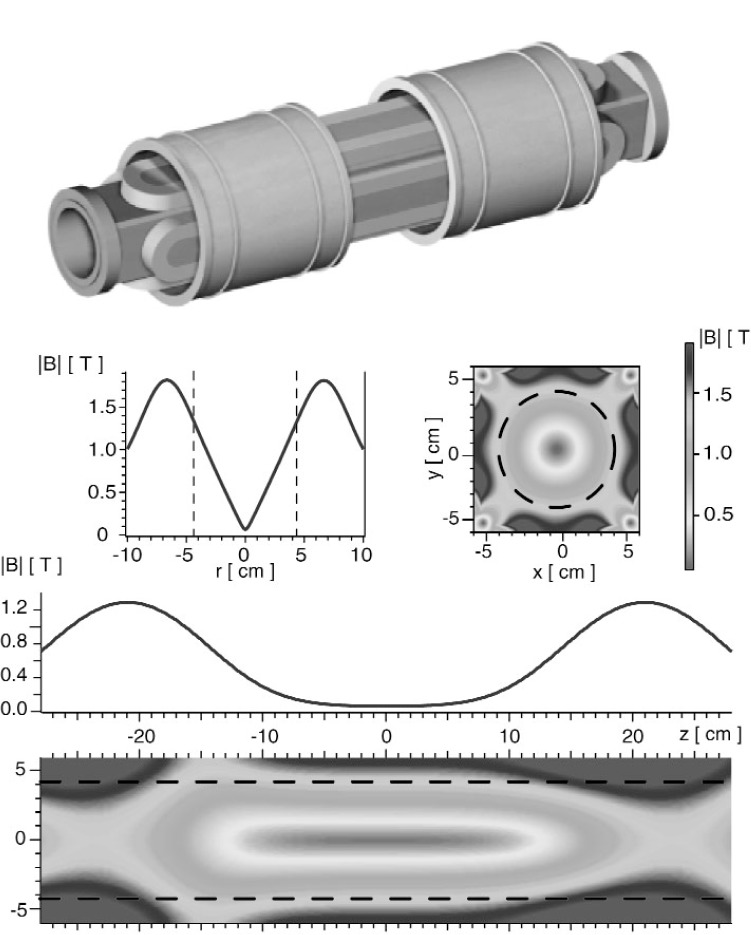
Fig. 1.
Magnet trap for confining ultracold neutrons [1–3]. A rendering of the magnet coils and form is shown at the top. The two graphs depict the magnitude of the magnetic field as a function of r (along z = 0) and z (along x = 0). The two contour plots show the two dimensional field profiles in the x – y plane (at z = 0) and in the x – z plane (at y = 0). The dashed lines denote the physical walls of the trap.

