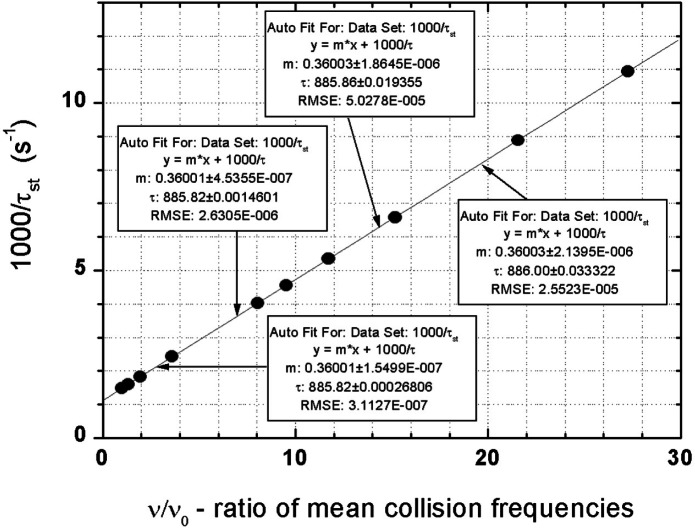
Fig. 2.
Test of linearity of a plot of inverse storage lifetime τst−1, versus relative wall collision rate ν/ν0. For the largest trap volume Vmax, ν0 = 51.9 Hz. The τst−1 -values are mean values for the storage interval from t1 = 300 s to t2 = 2300 s (for the largest volume). The collision rates are mean values for the same time interval. The windows show results of linear fits for subgroups of points (counting from the left): bottom: 1–4; left: 1–5; top: 1–10; right: 7–10. Extrapolated y-axis intersections agree within 0.3 s with the value τn = 886 s used in all calculations. The error ranges reflect residuals and do not include counting statistics.

